Xplico

Downloading Xplico
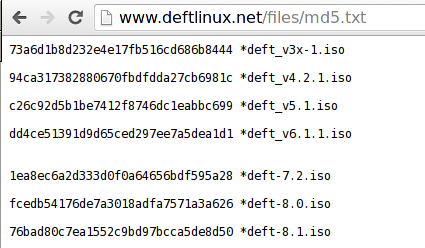
In this article we'll present Xplico, which is a network forensics tool installed in major digital forensics Linux distributions like Kali, Backtrack, Security Onion, DEFT, etc. In this tutorial, we'll take a look at the DEFT Linux distribution, which we can download from here: we need to download the 3GB large deft-8.1.iso file. Additionally, we can also take a look at the enclosed md5.txt file, which presents the MD5 hashes of the present files, presented on the picture below.
Learn Digital Forensics
We can use the MD5 hashes in order to check whether the downloaded file has the same signature, which verifies that we've downloaded the same version of the file. Thus, nobody has tampered with the file when being downloaded, which can happen if an attacker has gained access to one of the intermediary points in the data transmission: in most cases, it happens through MITM attacks on your local LAN. It's fairly easy to check whether the files are the same by using the md5sum program as presented below.
[plain]
# md5sum -b deft-8.1.iso
76bad80c7ea1552c9bd97bcca5de8d50 *deft-8.1.iso
Notice that the hash of the deft-8.1.iso matches the one presented at http://www.deftlinux.net/files/md5.txt? This is a clear indication that the files are the same and at this point, we can use the file without a bad aftertaste, since we know the file is valid and legit. After downloading a valid version of DEFT, we can boot it up by using standard virtualization tools like Vmware/VirtualBox, but we'll use Qemu. First we have to create the Qemu image with the command below:
# qemu-img create -f qcow2 /home/deft.qcow2 20G
Then, we can use the following script to start DEFT Linux:
[plain]
#!/bin/bash
/usr/bin/qemu-kvm
-machine accel=kvm
-cpu core2duo
-name DEFT
-cdrom /home/deft-8.1.iso
-boot order=d
-drive file=/home/deft.qcow2,if=ide,cache=writeback
-m 1G
-enable-kvm
-monitor stdio
-smp 1,sockets=1,cores=1,threads=1
-nodefaults
-usbdevice tablet
-rtc base=localtime
-full-screen
-vga qxl
-device virtio-serial-pci
-device virtio-balloon-pci,id=balloon0,bus=pci.0,addr=0x6
-device e1000,netdev=net0,mac=00:26:c6:21:cf:39
-netdev tap,id=net0,script=no,ifname=tap0,downscript=no
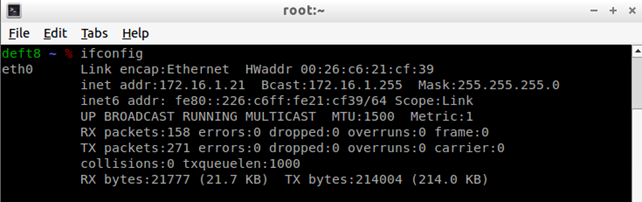
We can also use simpler script with just a few lines, but the above script is used to set the specific MAC address to the eth0 network interface as well as use user networking and also share the /home/ directory between host and guest. Then, we can boot into the livecd version of the DEFT operating system or install the system to /home/deft.qcow2 as already configured. When the system has finished booting up, we can see the eth0 interface settings, where the IP address 172.16.1.21 has been assigned to the eth0 interface.
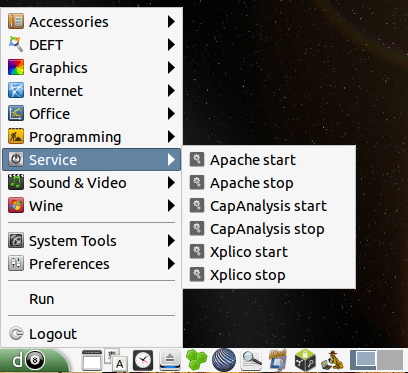
Next, we must first start the Apache web server and Xplico application in Menu – Service – Apache start/Xplico start, as shown below.
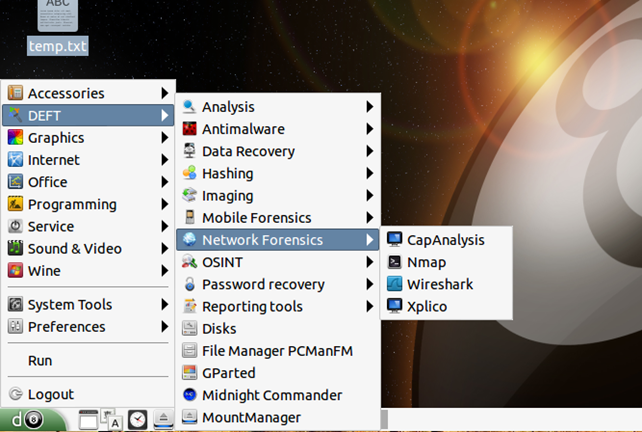
When both services are started, we need to load the Xplico application in a browser by going to: Menu – DEFT – Network Forensics – Xplico as shown below.
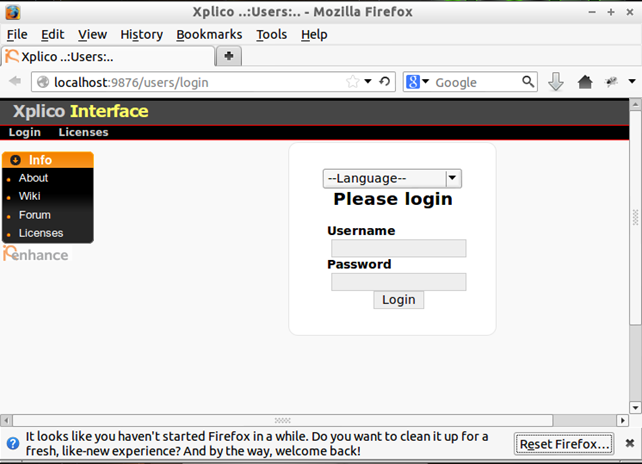
A Firefox web browser will be started on http://172.16.1.21:9876/users/login as shown on the picture below, where we have to login to Xplico with default credentials xplico:xplico.
Xplico Components
The Xplico system is built on four components:
- Decoder Manager
- IP Decoder
- Data Manipulators
- Visualization System
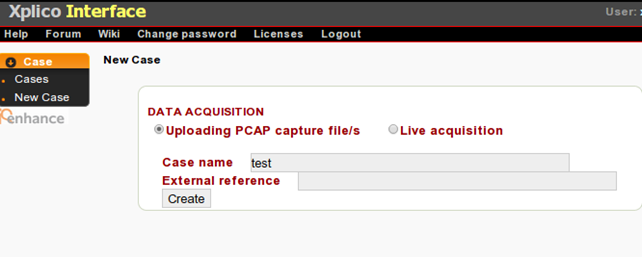
When connected to the Xplico web interface, we can start a new case by either uploading a PCAP capture file or acquire the data live from existing interfaces. In our case, we'll create a test use case, which defines the capture point in a network.
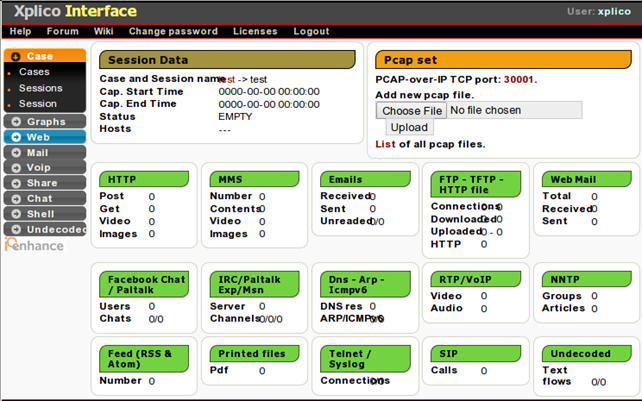
After creating a new case, we also have to create a new session, where each case can have multiple sessions differentiated by the time interval; note that each session can have multiple pcap files. A new session can be created by clicking on the 'New Session' link on the left side of the menu. In the new session, the following will be shown, where all the supported protocols don't have any numbers assigned to them, since we haven't yet uploaded a pcap file. The picture below also presents an option where we can choose the pcap file and upload it. When the pcap file is uploaded, the Xplico will automatically start decoding and analyzing the file, which will be shown by a red text 'File uploaded, start decoding...' on the top of the page.
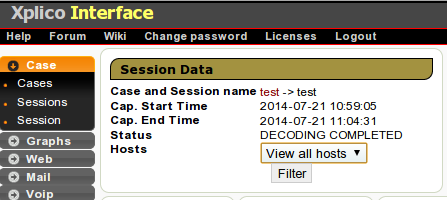
Once the file has been decoded, we can choose the 'View all hosts' option under the 'Status Hosts' as seen below; alternatively we can select an individual host.
The analyzed results will look something like presented below. We can see that Xplico can automatically analyze a lot of protocols.
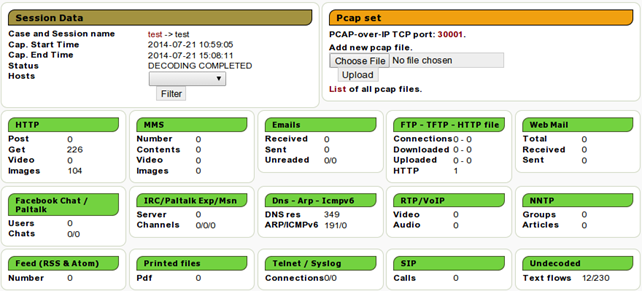
The great thing about Xplico is that it can automatically parse and analyze the pcap files or acquired network traffic. Imagine the pcap file being analyzed by Wireshark, where we have to input the filter in order to show only a subset of all data; the data which we're interested in. Then we can select the interesting packet, right-click on it and follow the stream. Doing that for each and every packet would quickly become tiresome, since we don't have the time or energy to analyze all the traffic in such a way. Therefore, Xplico is a great tool which can be used to considerably reduce the time that would normally be needed for analysis. Let's now take a look at what Xplico can do by using the analyzed pcap file.
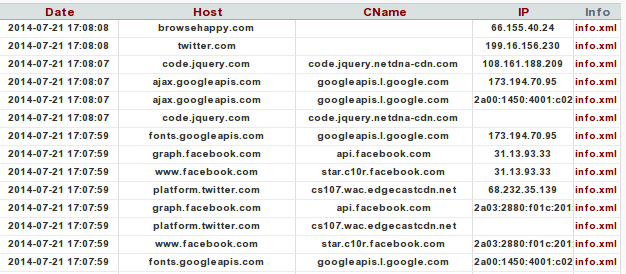
If we click on the Graphs – DNS, all the DNS requests will be presented in a easy to understand manner. Each entry has four fields: Date, Host, CName and IP address. The Date presents the time at which the DNS query has been sent, the Host presents the domain name for which IP was requested, the CName presents the DNS cname records (if one exists – cname is an alias of the domain) and IP address presents the requested IP address. Let's take a look at how Xplico identifies and presents the DNS protocol information, which is presented below.

To present the DNS request for twitter.com in a Wireshark, we can use the 'dns and dns.qry.name==twitter.com' filter as shown below.
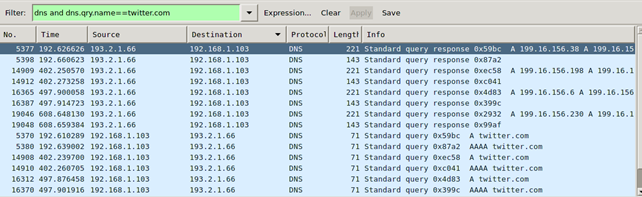
The second column on the picture above uses the number of seconds since the start of the capture, but doesn't show us the exact time at which request was made. That can be changed directly in Wireshark by selecting an option View – Time Display Format – Date and Time of Day. Notice that the first twitter request in Xplico has been issued at 15:08:08, while in Wireshark the date is 17:08:08? The time difference comes because the data was obtained from a computer in a different time zone than the time zone where DEFT Linux has been installed.
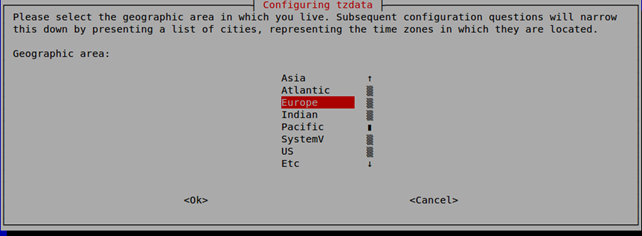
To solve the issue, we have to change the time zone of the DEFT Linux, which we can do by executing the "sudo dpkg-reconfigure tzdata" command and choosing the right time zone as presented below.
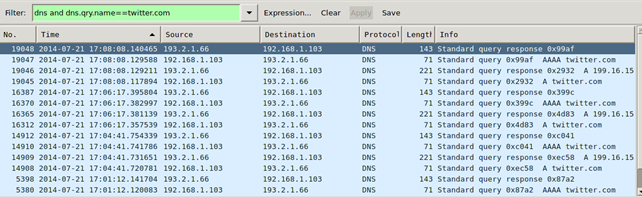
After that we have to create a new session and reupload the data for changes in Xplico to take effect. The new DNS requests will now look like below, where we can see that the time is the same as in Wireshark.
The Host field as shown in Xplico can just as easily be seen in Wireshark in the Info column; it isn't as pretty though, because the Wireshark presents some other information not that relevant to some use cases. Therefore, Xplico does a good job abstracting away the details in order to present the information in a clear and concise way.
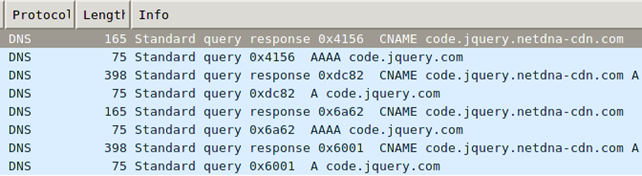
The CName column can also be easily seen in the Wireshark in the Info column. In order to see it we have use the "dns and dns.qry.name==code.jquery.com" filter, since twitter.com didn't have the CNAME. You can see the same information as in previous Xplico screenshot on the picture below, where the "code.jquery.netdna-cdn.com" is shown.
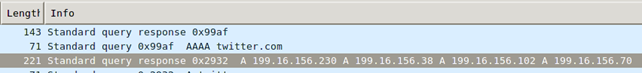
The requested IP address can also be viewed in the Info column in Wireshark as seen below: notice that the returned A DNS records contain four IP addresses all relative to the twitter.com domain?
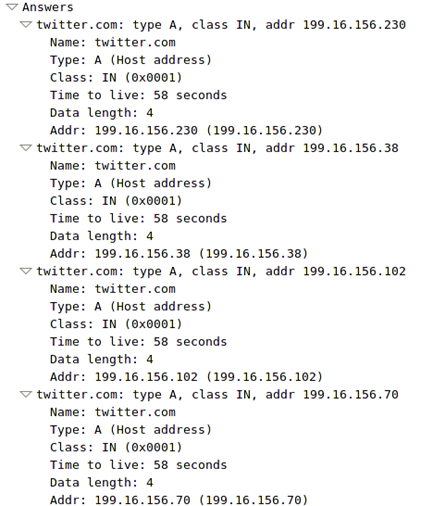
If we look at the packet details in Wireshark, we can see the Answers section, which actually contains the four returned addresses. But Xplico reported just one IP address, which is the first one on the list that is used anyway. Upon subsequent DNS requests for the same domain, the order of IP addresses will very likely be different, which will cause the client to use that IP address. Therefore, we're not losing much when Xplico doesn't report all returned IP addresses, because the first one is used anyway.
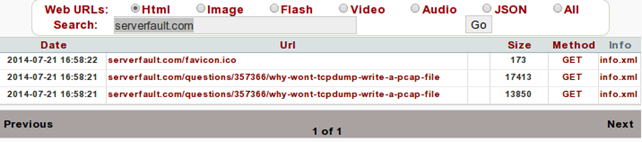
We've seen how Xplico compared to Wireshark when analyzing data: Xplico has analyzed the data and abstracted away all the details that we're not interested in, which makes it great for quickly viewing the results of analyzed data. Let's also see the other features of Xplico, which allows us to see the actual GET requests, which can be filtered by input string. The picture below presents all the requests to webpage 'serverfault.com':
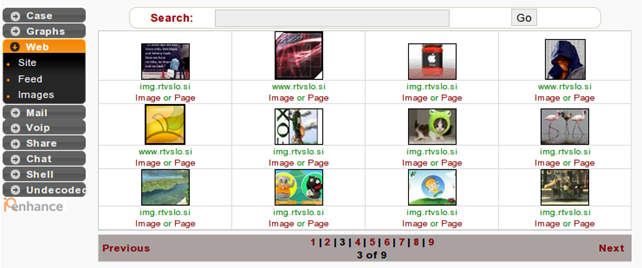
One really cool feature of Xplico is reconstruction of images, which is accessible in the Web – Images menu as seen below. Notice that the images can be seen just as they presented in an actual web page. This makes it very easy to see the actual images, while viewing such information in Wireshark is very hard.
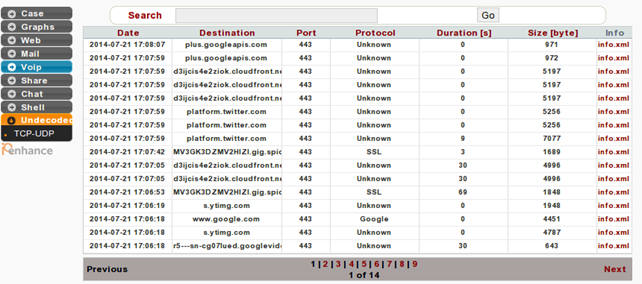
In the Undetected menu we can observe all the traffic that wasn't detected and processed by Xplico. Such traffic is presented below, where we can see the date of the actual traffic, the destination domain names and port numbers, as well as other information.
Conclusion
In this article we've seen that Xplico is a great tool for analyzing network traffic, since it has multiple protocol dissectors, which can be used to analyze specific protocols inside the .pcap file. The obtained results are presented in an easy to undestand web interface, which does a great job in presenting all the relevant information to the users. We've also taken a look at Wireshark and how it compares to Xplico, but let me summarize that Xplico is not an alternative to Wireshark; it's merely a tool which does a great job in analyzing and presenting information in nice colorful graphs and tables in a web interface.
References
[1] Xplico,
Learn Digital Forensics

In this Series
- Xplico
- Digital forensics and cybersecurity: Setting up a home lab
- Top 7 tools for intelligence-gathering purposes
- iOS forensics
- Kali Linux: Top 5 tools for digital forensics
- Snort demo: Finding SolarWinds Sunburst indicators of compromise
- Memory forensics demo: SolarWinds breach and Sunburst malware
- Digital forensics careers: Public vs private sector?
- Email forensics: desktop-based clients
- What is a Honey Pot? [updated 2021]
- Email forensics: Web-based clients
- Email analysis
- Investigating wireless attacks
- Wireless networking fundamentals for forensics
- Protocol analysis using Wireshark
- Wireless analysis
- Log analysis
- Network security tools (and their role in forensic investigations)
- Sources of network forensic evidence
- Network Security Technologies
- Network Forensics Tools
- The need for Network Forensics
- Network Forensics Concepts
- Networking Fundamentals for Forensic Analysts
- Popular computer forensics top 19 tools [updated 2021]
- 7 best computer forensics tools [updated 2021]
- Spoofing and Anonymization (Hiding Network Activity)
- Browser Forensics: Safari
- Browser Forensics: IE 11
- Browser Forensics: Firefox
- Browser forensics: Google chrome
- Webinar summary: Digital forensics and incident response — Is it the career for you?
- Web Traffic Analysis
- Network forensics overview
- Eyesight to the Blind – SSL Decryption for Network Monitoring [Updated 2019]
- Gentoo Hardening: Part 4: PaX, RBAC and ClamAV [Updated 2019]
- Computer forensics: FTK forensic toolkit overview [updated 2019]
- The mobile forensics process: steps and types
- Free & open source computer forensics tools
- An Introduction to Computer Forensics
- Common mobile forensics tools and techniques
- Computer forensics: Chain of custody [updated 2019]
- Computer forensics: Network forensics analysis and examination steps [updated 2019]
- Computer Forensics: Overview of Malware Forensics [Updated 2019]
- Incident Response and Computer Forensics
- Computer Forensics: Memory Forensics
- Comparison of popular computer forensics tools [updated 2019]
- Computer Forensics: Forensic Analysis and Examination Planning
- Computer forensics: Operating system forensics [updated 2019]
- Computer Forensics: Mobile Forensics [Updated 2019]
- Computer Forensics: Digital Evidence [Updated 2019]

Get certified and advance your career
- Exam Pass Guarantee
- Live instruction
- CompTIA, ISACA, (ISC)², Cisco, Microsoft and more!

Digital forensics

Digital forensics

Digital forensics
Digital forensics