Windows Kernel Debugging Symbols and Commands

Introduction
In this tutorial, we'll introduce a few basic tools that we need to have available when doing kernel debugging on Windows. Besides that, we'll present Windows debuggers that can help us with debugging Windows programs and Windows internals. We'll also take a look at how we can go about symbols, which are an important aspect of kernel debugging. At the end, we'll take a look at the command we can use in the user or kernel-mode debuggers that come with windows debugging tools.
Let's present a few of the tools that we absolutely need when kernel debugging in Windows. The needed tools are as follows:

Become a certified reverse engineer!
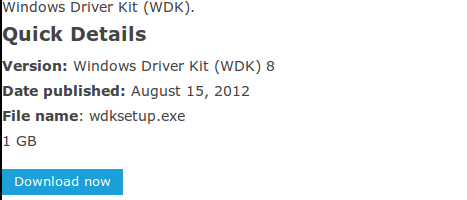
- WDK (Windows Driver Kit): include the tools and documentation to develop drivers. WDK is already integrated into Visual Studio 2012 [1]. Keep in mind that the WDK was previously known as DDK. If you're installing the WDK on Windows Vista, Windows 7 or Windows Server 2008/2012, you can download and install WDK 8 from the page http://msdn.microsoft.com/en-US/windows/hardware/hh852362, where the download link looks like this:
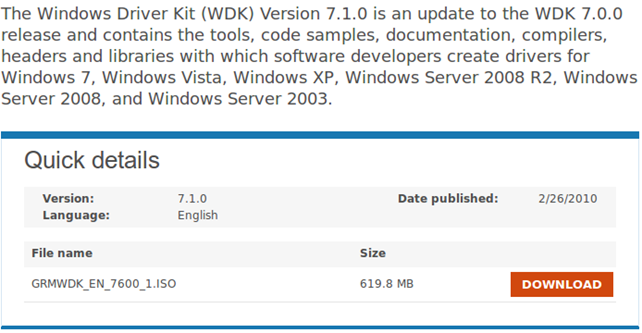
But if you're using older versions of Windows, you must install the WDK 7.1.0, which we can download from the http://www.microsoft.com/en-us/download/details.aspx?id=11800 URL, where the download link looks like this:
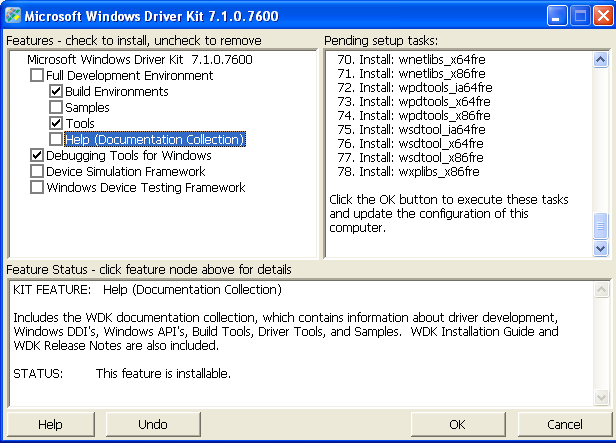
Upon downloading the ISOimage, we must mount it and start the KitSetup.exe executable. On the picture below, we can see a step in the installation where we can choose what would we like to install; notice that we can also check the Windows Debugging Tools?
During the installation all the files will be copied to the C:WinDDK7600.16385.1 directory.
- SDK (Windows Software Development Kit): provides various header files and libraries that we'll need when writing or compiling certain tools with Visual Studio. We've also used a quite handy tool called dumpbin.exe, which comes with the SDK package.
- Windows Debugging Tools: debugging tools are used to debug drivers, applications, and services on Windows systems. The Windows debugging tools can be installed as part of the WDK or SDK packages, but we can also install them as a separate component. We can get more information about Windows debugging tools at [2].
- Windows Symbol Packages: when the applications and libraries are linked, the linker (besides the executable) also creates symbol files that are very useful when debugging. This is because they provide names for various addresses and structures, which we find easier to work with than actual addresses and numbers. Various tools can download the symbol files directly from Microsoft symbol server, but we can also download the entire symbol package for our version of Windows. We can download the entire symbol package from the http://msdn.microsoft.com/en-us/windows/hardware/gg463028URL. Symbols are installed in the C:WINDOWSsymbols directory by default and are kept in the PDB files. The PDF files contain metadata information like the names and addresses of variables, functions and other structures in a program or a library.
- Open Watcom: can be used whenever we want to build and compile 16-bit programs, which can come in handy in real mode, which provides a 16-bit environment.
But besides the tools listed above, we still need the most important tool, which is the debugger, either user or kernel-mode debugger. Normally, it's good to have both kinds of debuggers at our disposal. Let's take a look at a simple "Hello World!" example in Visual Studio. The code below is a C++ code compiled in Visual Studio that prints the "Hello World!" string to the console windows anD quits:
[cpp]
#include "stdafx.h"
int _tmain(intargc, _TCHAR* argv[])
{
printf("Hello World!");
return 0;
}
The Debug directory contains the files presented on the pictures below:
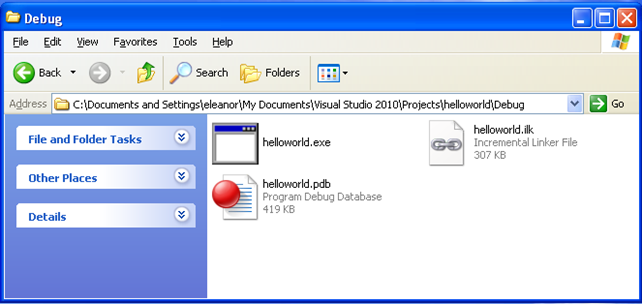
It's not hard to recognize that the helloworld.exe executable is the compiled versions of the above source code. But we can also see a file named helloworld.pdb in the same directory: that file holds the symbol information about the executable. Then we can use a tool like symchk that is able to check which symbols (if any) have been exported for the particular executable. If we run the symchk tool without any arguments, the following will be displayed to the console windows (note that the output has been shortened for brevity):
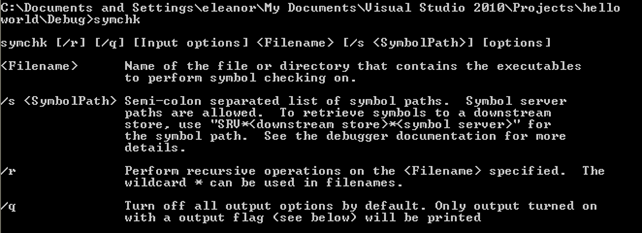
From the instructions above, we can immediately recognize that only the filename is the required argument, which we must pass to the symchk command. If we won't specify the /s option, the value in the _NT_SYMBOL_PATH will be used instead. If that environment variable is not set, then the /s will use the default option "SRV*%SYSTEMROOT SYMBOLS*http://msdl.microsoft.com/download/symbols". In our case, we have a standalone PDB file, which we must specify when using the /s option. On the picture below, we've passed the current directory to the /s argument (this is the directory where the PDB file should be located), and we used the /ps argument to check whether the PDB files have been stripped of debugging information:
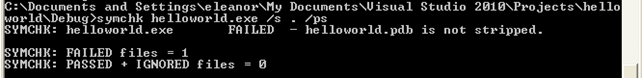
We can see that the helloworld.pdb is not stripped, which means that it still contains the symbol information.
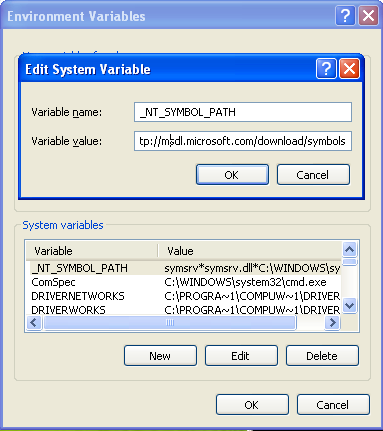
We've just seen the symbol files of the currently compiled programs, but what about system wide components? Where can we get its symbol files? We can download the symbol files from the Internet and install them appropriately on the system. Another way of getting the latest symbol files from the Internet is by setting the _NT_SYMBOL_PATH environmental variable, which holds the following value:
[plain]
symsrv*symsrv.dll*C:WINDOWSsymbols*http://msdl.microsoft.com/download/symbols
The picture below shows us how we can set such environmental variables:
Various Windows Debuggers
There are various debuggers that are contained in the Windows debugging tools and are listed below:
- cdb.exe : command-line user-mode debugger tool
- ntsd.exe : command-line user-mode debugger tool
- kd.exe : command-line kernel-mode debugger tool
- windbg.exe : GUI tool user and kernel-mode debugger tool
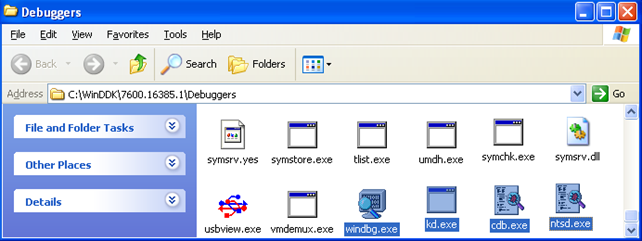
If we've installed the WDK, then all the debuggers are located in the C:WinDDK7600.16385.1Debuggers directory, which we must add to the PATH environmental variable if we would like to invoke them directly in cmd.exe. On the picture below, we can see the presence of all the debuggers listed above:
To start debugging some program with the cdb.exe or ntsd.exe debuggers, we have to use the following command to do it:
[plain]
>cdb helloworld.exe
>ntsd helloworld.exe
The only difference between those two tools is that when running ntsd command, another command line window will open with the debugged program, while this doesn't happen with the cdb debugger, where the current command line window is used for debugging.
The Debugger Commands
We can use the same commands in all of the above debuggers to do various things, like to set a breakpoint, delete a breakpoint, run the program, etc... But there are also some commands that are available only in kernel-mode debuggers, and they don't really apply to user-mode debuggers.
If we load the previous helloworld.exe program, we can list information from it. Let's first list all of the modules the program has loaded with the "x *!" command:
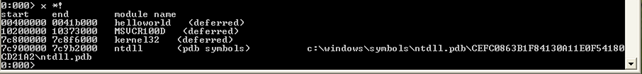
We can see that the helloworld executable was loaded along withthe following modules: msvcr100d, kernel32 and ntdll. There's also another command that can print all the loaded modules, the lm command.
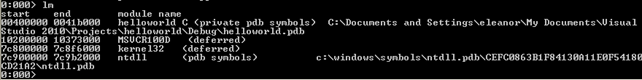
We can see that basically the same information was presented by both commands.
To list all of the symbols from the helloworld executable, we can execute the "x helloworld!*" command:
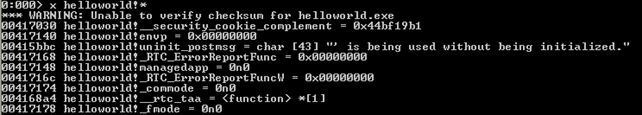
We can see that the first part of the symbols are presented on the picture above (note that all are not presented for brevity). Let's see if we can print some information about the printf symbol residing in the helloworld module:

We can see that the address where the printf function is used is at 0x0041140, but that isn't the actual address directly linked to the printf call that we used in our source code. The <no type information> means that the debugger cannot determine whether the symbol is a function or a variable, but we know it's a function in this case. To disassemble the assembly code at that address, we can use the d command like this:

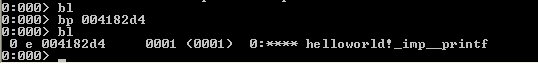
You should also know about breakpoints. To set a breakpoint on the printf statement above, you have to use the "bp 004182d4" command. The command will set a breakpoint on the specified address, which we've found about in the previous picture. On the picture below we can see that we've successfully set a breakpoint on the address that we've wanted. We also verified that the breakpoint is set by executing the bl command.
After that, we can run the g command to run the program. The program will stop the execution when the specified address will be reached and we'll have a chance to look around. One thing that can interest us at that point isthe registers that can be printed with the r command.
There are also other commands that we need to be aware of: the d* commands. They are used for printing the contents of memory to screen. There are multiple commands that start withletter 'd' and are presented below:
- db : this command dumps the contents of memory at specified address in bytes and in ascii representation, as we can see on the picture below:
dw: this command dumps the contents of memory as words, but with no ascii representationasseen below:
dW: this command dumps the contents of memory as words, but the ascii representation is presented as well, as seen below:
dd: this command dumps the contents of memory as dwords without the ascii representation as seen below:
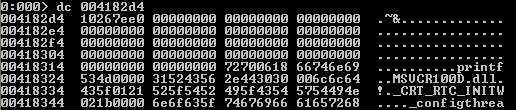
- dc: this command dumps the contents of memory as dwords, but the ascii representation is presented as well, as seen below:
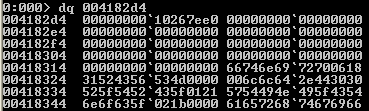
- dq: this command dumps the contents of memory as qwords without the ascii representation as seen below:
Keep in mind that there's a very good reference for commands that we can use with Windows debuggers available at this URL address: http://www.windbg.info/doc/1-common-cmds.html. I'm constantly using it as a reference.
Conclusion
In this tutorial, we've seen the basic tools that we need to have installed when debugging Windows applications or Windows kernel. These tools are WDK, SDK, symbol files and debugging tools. We need to keep in mind that we can debug Windows without those tools, but we'll have a hard time doing it; so why should we complicate our lives if we don't have to? Isn't it better to just download the tools and use them rather than spending time doing something that should be rather easy (if we had the tools installed)?
Let me give you an example why you should have the symbol files installed: when doing debugging, you're probably not very happy when only addresses and hexadecimal numbers are being displayed to you, because they don't mean anything to us. Rather than that, we're used to work with strings (the symbols), which can help us understanding the underlying assembly code much faster and with greater accuracy.
If you're serious about kernel debugging, you should really invest the time to download and install the tools presented above, because they can be of great help. You should do the same if you're a hardcore driver developer, but if you're developing a simple, user-mode software that doesn't have to interact with the kernel, then you probably don't want to spend the time installing and learning about the tools above. But if you do it nevertheless, it can be of great help in understanding Windows internals, which can help you in development engagements to come. It's never a bad thing to know how to debug the kernel.
References:
[1] Windows Driver Kit (WDK), accessible at http://msdn.microsoft.com/en-us/library/windows/hardware/gg487428.aspx.
Become a certified reverse engineer!
[2] Download and Install Debugging Tools for Windows, accessible at http://msdn.microsoft.com/en-us/windows/hardware/gg463009.aspx.
- Exam Pass Guarantee
- Live expert instruction
- Hands-on labs
- CREA exam voucher
In this Series
- Windows Kernel Debugging Symbols and Commands
- Kali Linux: Top 8 tools for reverse engineering
- Stacks and Heap
- Top 8 reverse engineering tools for cyber security professionals [updated 2021]
- Arrays, Structs and Linked Lists
- Reverse engineering obfuscated assemblies [updated 2019]
- Crack Me Challenge Part 4 [Updated 2019]
- Writing windows kernel mode driver [Updated 2019]
- Assembly programming with Visual Studio.NET
- The basics of IDA pro
- Reverse engineering tools
- Hacking tools: Reverse engineering
- Reverse engineering a JavaScript obfuscated dropper
- Reverse Engineering – LAB 3
- Exploiting Protostar – Stack 0-3
- Reversing Binary: Spotting Bug without Source Code
- Reverse engineering virtual machine protected binaries
- Introduction to Reverse Engineering
- Pafish (Paranoid Fish)
- Extending Debuggers
- Encrypted code reverse engineering: Bypassing obfuscation
- Buffer Overflow Attack & Defense
- Invoking Assembly Code in C#
- iOS Application Security Part 32 - Automating tasks with iOS Reverse Engineering Toolkit (iRET)
- Hooking IDT
- A Guide to Debugging Android Binaries
- Kernel debugging with Qemu and WinDbg
- Shared Folders with Samba and Qemu
- Testing Hooks via the Windows Debugger – An Introduction to RevEngX
- Reverse Engineering with Reflector
- Applied Reverse Engineering with IDA Pro
- Injecting spyware in an EXE (code injection)
- Disassembler Mechanized Part 4: DLL Injector Development
- Disassembler Mechanized Part 3: Code Injection Operation
- Debugging TLS callbacks
- Disassembler Mechanized Part 2: Generating C# and MSIL code
- System address map initialization in x86/x64 architecture part 2: PCI express-based systems
- Coding of Disassembler
- Applied cracking & byte patching with IDA Pro
- .NET reversing with Reflexil
- Reversing firmware part 1
- Reverse Engineering with Reflector: Part 1
- Remoting Technology
- Reverse engineering with OllyDbg
- Understanding Session Fixation
- Optimizing Managed Code Execution
- File system manipulation
- The BodgeIt store part two
- The BodgeIt store part one
- Understanding Windows Internal Call Structure
- Pin: Dynamic Binary Instrumentation Framework

Get certified and advance your career
- Exam Pass Guarantee
- Live instruction
- CompTIA, ISACA, (ISC)², Cisco, Microsoft and more!

Reverse engineering
Reverse engineering
Reverse engineering
Top 8 reverse engineering tools for cyber security professionals [updated 2021]
Reverse engineering