Wireshark

A network sniffer or protocol analyzer is a software application or hardware device which is capable of intercepting traffic and logging it for further analysis. A packet sniffer is very crucial for network analysis as well as troubleshooting; hence it is widely used by Pentesters, Network Analysts and Network Administrators. The network sniffer software simply sits on a machine connected to the network and logs all the traffic it can listen to.
This log can be analyzed to:
Earn two pentesting certifications at once!
Enroll in one boot camp to earn both your Certified Ethical Hacker (CEH) and CompTIA PenTest+ certifications — backed with an Exam Pass Guarantee.
-
Study the interaction of different machines.
-
Analyze the packets that are passing by.
-
Learn more about the underlying protocols.
-
Detect the flaws in the network.
-
Examine security issues.
Many packet sniffers are available out there and all of them provide different features but Wireshark stands out from the rest due to its rich set of features and easy to use interface. Previously known as 'Ethereal,' Wireshark presents the user with a rich GUI that has easy-to-implement features and makes the process of packet analysis simple, even for a novice. Wireshark requires winpcap (packet capture and filtering engine) for its capture and analysis functions, although it comes along with the default installation of Wireshark.
Let's dive deep into this fantastic tool and understand some of its features:
After installing the application and starting it, the first thing to do is to choose the Interface(s) to start with. Interface list displays all the interfaces present on the machine so we can choose the one(s) we want to listen on. Before starting the capture on the network, we should also specify whether we want to capture packets in promiscuous mode or not. Promiscuous mode if enabled (enabled by default) allows Wireshark to capture all the packets it can over the network, else only packets to and from the machine running Wireshark will be captured. We can decide on this function from the options button in the Capture Interfaces list and start the process of capturing the packets. Now based on the amount of network traffic, the packets will be captured and listed on the interface in real time for analysis. Figure 1 shows the interface list and the options to start the capture.
[caption id="" align="alignnone" width="624"]") Figure 1. Wireshark Interface List and Options (Click to Enlarge)[/caption]
Figure 1. Wireshark Interface List and Options (Click to Enlarge)[/caption]
First thing you'll notice from this packet capture is that Wireshark uses different color coding for different packets. This color coding helps us to distinguish between different packet types and hence is useful for quick overview. For example, black foreground on green background is used to display HTTP packets while the reverse is used to indicate ICMP errors. These color coding combinations can be customized according to personal preference. Figure 2 displays the color coding in the captured packets.
[caption id="" align="alignnone" width="624"]") Figure 2. Wireshark packet capture color coding (Click to Enlarge)[/caption]
Figure 2. Wireshark packet capture color coding (Click to Enlarge)[/caption]
We have seen how Wireshark captures packets in real time and displays them on the interface; now let's see how to filter these packets.
Packet filtering is a very essential feature. We can see that during the capture, there are various kinds of packets (protocols) that are captured and we need to focus on some specific packets. Wireshark allows traffic filtering based on different filters, which can be specified before as well as after the capture. We can simply input the protocol name in the filter bar and press Enter to see the packets of that specific protocol on the interface with the rest all removed. For example, if we need only HTTP traffic on the interface, we can simply input 'http' (without quotes) into the filter box and get the result. Wireshark also supports advanced filters which include expressions, IP address, MAC address, port number etc. Figure 3 shows the packets being listed according to the applied filter.
Some of the example filters are as following:
Ethernet broadcast: eth.addr==ff:ff:ff:ff:ff:ff
IP address 192.168.0.1: ip.addr==192.168.0.1
UDP only: udp
No ARP and no DNS: not arp and!(udp.port==53)
[caption id="" align="alignnone" width="623"]") Figure 3. Wireshark Packet Filtering (Click to Enlarge)[/caption]
Figure 3. Wireshark Packet Filtering (Click to Enlarge)[/caption]
All these filters are built-in to the application and can be accessed by clicking on the filter button. But this is not all: Wireshark also allows users to create custom filters and add them to this list and use them in future. This task can simply be accomplished by clicking on the 'New' button in the filter list and specify the filter name and filter string. For example, we can create a filter capturing packet from a specific IP range:
IP Range 192.168.0.0./24: ip.addr==192.168.0.0/24
The top block of the interface shows all the packets captured based on the filter applied, the middle block consists of all the detailed information regarding the packet selected in the top block, and the lowest block displays the hexdump of the selected packet. To analyze a packet, we simply need to select it in the top block and browse through the information in the middle block like the IP address, MAC address and other details related to the protocol structure. The information we selected in the middle block is displayed with the corresponding presence in the hexdump.
Let's analyze a simple packet now. ARP filter has been applied so that the packets displayed are ARP packets only. We have selected an ARP request packet in the top block; an ARP request packet is broadcasted with the IP address that needs to be resolved with the MAC address. Now we can browse through all the information in the middle block like Sender MAC address, Sender IP address, Target IP address, protocol size etc. Figure 4 shows the ARP packet details.
[caption id="" align="alignnone" width="624"]") Figure 4. ARP packet analysis (Click to Enlarge)[/caption]
Figure 4. ARP packet analysis (Click to Enlarge)[/caption]
Wireshark also allows seeing the communication between two machines as a stream. We can simply select a packet and right click on it, and then based on the protocol, we can select the option to follow the stream and view the exact communication. This feature is quite useful if we need to understand the communication between two machines or if we are looking for some specific information (e.g. password) that is being passed between them. The text below shows a sample TCP stream.
GET / HTTP/1.1 Host: 192.168.118.130 Connection: keep-alive User-Agent: Mozilla/5.0 (Windows NT 6.1) AppleWebKit/537.11 (KHTML, like Gecko) Chrome/23.0.1271.95 Safari/537.11 Accept: text/html,application/xhtml+xml,application/xml;q=0.9,*/*;q=0.8 Accept-Encoding: gzip,deflate,sdch Accept-Language: en-US,en;q=0.8 Accept-Charset: ISO-8859-1,utf-8;q=0.7,*;q=0.3
HTTP/1.1 200 OK Date: Wed, 05 Dec 2012 08:10:29 GMT Server: Apache/2.2.14 (Ubuntu) Last-Modified: Tue, 10 May 2011 07:45:00 GMT ETag: "2c58a-b1-4a2e722183700" Accept-Ranges: bytes Vary: Accept-Encoding Content-Encoding: gzip Content-Length: 146 Keep-Alive: timeout=15, max=100 Connection: Keep-Alive
..........NK..0..s.qol.7......(._I..p{+..f....39.r..Mw.P.......:;.g.+.4..._..a.........,_..5.Y..:d......;e..e@X......E............9...i..h4*.....GET /favicon.ico HTTP/1.1 Host: 192.168.118.130 Connection: keep-alive Accept: */* User-Agent: Mozilla/5.0 (Windows NT 6.1) AppleWebKit/537.11 (KHTML, like Gecko) Chrome/23.0.1271.95 Safari/537.11 Accept-Encoding: gzip,deflate,sdch Accept-Language: en-US,en;q=0.8 Accept-Charset: ISO-8859-1,utf-8;q=0.7,*;q=0.3 DNT: 1
HTTP/1.1 404 Not Found Date: Wed, 05 Dec 2012 08:10:29 GMT Server: Apache/2.2.14 (Ubuntu) Vary: Accept-Encoding Content-Encoding: gzip Content-Length: 240 Keep-Alive: timeout=15, max=99 Connection: Keep-Alive Content-Type: text/html; charset=iso-8859-1
..........MO]K.0.}....I..mj..!0...u.M...-.)..&...o.!.p..{>8..Tok.okx.. ..s.]...q[. b%.+S....-x.L.<sf.Ti.}<k^.%.....bx=f.g.;8.3.(..I
[.......F..V..7.'y......-..d:M&p....../.......H......y4..R.Z.mw.m...c
6..@....$..y..u>.2g...Z.}S........."...
Using Wireshark, we can create ACL (Access Control List) rules for different firewalls including Cisco IOS, IP Filter, NetFilter, Windows Firewall, etc. These rules can be applied to the appropriate firewall interface. To utilize this feature, we simply need to navigate to the Tools menu and select the Firewall ACL Rules options. Figure 5 shows the firewall ACL rules option present and Lua console in Wireshark.
[caption id="" align="alignnone" width="624"]") Figure 5. Firewall ACL rules option (Click to Enlarge)[/caption]
Figure 5. Firewall ACL rules option (Click to Enlarge)[/caption]
Wireshark provides support for Lua. Lua is a lightweight yet powerful programming language. It can be used to write dissectors and taps.
Wireshark also allows saving the captured packets into various formats which can be utilized for later analysis by Wireshark or any other packet analysis applications. Similarly, Wireshark is also capable of reading packets from various different format packet captures.
Apart from the GUI interface, we can also utilize the power of this tool through the command line version 'tshark'. Below is the listing of the options provided by tshark:
[bash]TShark 1.8.3 (SVN Rev 45256 from /trunk-1.8)
Dump and analyze network traffic.
Copyright 1998-2012 Gerald Combs <gerald@wireshark.org> and contributors.
This is free software; see the source for copying conditions. There is
Usage: tshark [options] ...
Capture interface:
-i <interface> name or idx of interface (def: first non-loopback)
-f <capture filter> packet filter in libpcap filter syntax
-s <snaplen> packet snapshot length (def: 65535)
-p don't capture in promiscuous mode
-B <buffer size> size of kernel buffer (def: 1MB)
-y <link type> link layer type (def: first appropriate)
-D print list of interfaces and exit
Capture stop conditions:
-c <packet count> stop after n packets (def: infinite)
-a <autostop cond.> ... duration:NUM - stop after NUM seconds
filesize:NUM - stop this file after NUM KB
Capture output:
-b <ringbuffer opt.> ... duration:NUM - switch to next file after NUM secs
filesize:NUM - switch to next file after NUM KB
Input file:
-r <infile> set the filename to read from (no pipes or stdin!)
Processing:
-2 perform a two-pass analysis
-R <read filter> packet filter in Wireshark display filter syntax
-n disable all name resolutions (def: all enabled)
-N <name resolve flags> enable specific name resolution(s): "mntC"
-d <layer_type>==<selector>,<decode_as_protocol> ...
"Decode As", see the man page for details
Example: tcp.port==8888, http
-H <hosts file> read a list of entries from a hosts file, which
Output:
-w <outfile|-> write packets to a pcap-format file named "outfile"
(or to the standard output for "-")
-C <config profile> start with specified configuration profile
-F <output file type> set the output file type, default is pcapng
an empty "-F" option will list the file types
-V add output of packet tree Packet Details)
-O <protocols> Only show packet details of these protocols, comma
separated
-P print packets even when writing to a file
-S <separator> the line separator to print between packets
-x add output of hex and ASCII dump (Packet Bytes)
-T pdml|ps|psml|text|fields
format of text output (def: text)
-e <field> field to print if -Tfields selected (e.g.
tcp.port);
this option can be repeated to print multiple
fields
-E<fieldsoption>=<value> set options for output when -Tfields selected:
header=y|n switch headers on and off
separator=/t|/s|<char> select tab, space, printable character as
separator
occurrence=f|l|a print first, last or all occurrences of each
field
aggregator=,|/s|<char> select comma, space, printable character as
aggregator
quote=d|s|n select double, single, no quotes for values
-t ad|a|r|d|dd|e output format of time stamps (def: r: rel. to
first)
-u s|hms output format of seconds (def: s: seconds)
-l flush standard output after each packet
-q be more quiet on stdout (e.g. when using
statistics)
-W n Save extra information in the file, if
supported.
n = write network address resolution
information
-X <key>:<value> extension options, see the main page for details
Miscellaneous:
-h display this help and exit
-v display version info and exit
-o <name>:<value> ... override preference setting
-K <keytab> keytab file to use for kerberos decryption
-G [report] dump one of several available reports and exit
default report="fields"
Figure 6 shows a simple packet capture in tshark.
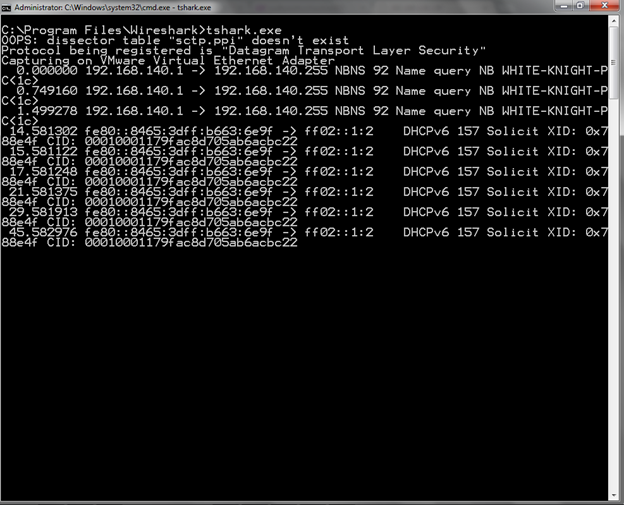
Figure 6. Tshark Packet Capture
Conclusion
Wireshark provides a rich set of features which can be used by Network Analysts, Administrators, Security Analysts and anyone who is curious to learn about networking. Utilizing these features allow us to effectively understand, troubleshoot and make our network(s) more secure.
Become a Certified Ethical Hacker, guaranteed!
Get training from anywhere to earn your Certified Ethical Hacker (CEH) Certification — backed with an Exam Pass Guarantee.
Would you like to test your skills further with a CTF challenge? Check this out:

- 12 pre-built training plans
- Employer-requested skills
- Personalized, hands-on training
In this Series
- Wireshark
- The rise of ethical hacking: Protecting businesses in 2024
- How to crack a password: Demo and video walkthrough
- Inside Equifax's massive breach: Demo of the exploit
- Wi-Fi password hack: WPA and WPA2 examples and video walkthrough
- How to hack mobile communications via Unisoc baseband vulnerability
- How to build a hook syscall detector
- Top tools for password-spraying attacks in active directory networks
- NPK: Free tool to crack password hashes with AWS
- Tutorial: How to exfiltrate or execute files in compromised machines with DNS
- Top 19 tools for hardware hacking with Kali Linux
- 20 popular wireless hacking tools [updated 2021]
- 13 popular wireless hacking tools [updated 2021]
- Man-in-the-middle attack: Real-life example and video walkthrough [Updated 2021]
- Decrypting SSL/TLS traffic with Wireshark [updated 2021]
- Dumping a complete database using SQL injection [updated 2021]
- Hacking clients with WPAD (web proxy auto-discovery) protocol [updated 2021]
- Hacking communities in the deep web [updated 2021]
- How to hack Android devices using the StageFright vulnerability [updated 2021]
- Hashcat tutorial for beginners [updated 2021]
- How to hack a phone charger
- What is a side-channel attack?
- Copy-paste compromises
- Hacking Microsoft teams vulnerabilities: A step-by-step guide
- PDF file format: Basic structure [updated 2020]
- 10 most popular password cracking tools [updated 2020]
- Popular tools for brute-force attacks [updated for 2020]
- Top 7 cybersecurity books for ethical hackers in 2020
- How quickly can hackers find exposed data online? Faster than you think …
- Hacking the Tor network: Follow up [updated 2020]
- Podcast/webinar recap: What's new in ethical hacking?
- Ethical hacking: TCP/IP for hackers
- Ethical hacking: SNMP recon
- How hackers check to see if your website is hackable
- Ethical hacking: Stealthy network recon techniques
- Getting started in Red Teaming
- Ethical hacking: IoT hacking tools
- Ethical hacking: BYOD vulnerabilities
- Ethical hacking: Wireless hacking with Kismet
- Ethical hacking: How to hack a web server
- Ethical hacking: Top 6 techniques for attacking two-factor authentication
- Ethical hacking: Port interrogation tools and techniques
- Ethical hacking: Top 10 browser extensions for hacking
- Ethical hacking: Social engineering basics
- Ethical hacking: Breaking windows passwords
- Ethical hacking: Basic malware analysis tools
- Ethical hacking: How to crack long passwords
- Ethical hacking: Passive information gathering with Maltego
- Ethical hacking: Log tampering 101
- Ethical hacking: What is vulnerability identification?
- Ethical hacking: Breaking cryptography (for hackers)

Get certified and advance your career
- Exam Pass Guarantee
- Live instruction
- CompTIA, ISACA, (ISC)², Cisco, Microsoft and more!


