Introduction to Kernel Debugging
Introduction
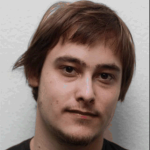
Before trying to debug the kernel, we must first understand a few things. We must know what the Rings in computer security are. Let's take a look at the picture taken from [1]:

On the picture above, we can see four protection rings, which are mechanisms to protect data and functionality from faults and malicious behavior. Each protection ring provides access to certain resources within the computer system, which is generally hardware-enforced. The most privileged ring is the ring 0 (kernel mode) and the least privileged ring is the ring 3 (user mode). Ring 0 has direct access to the hardware, such as CPU and memory. There are special gates between the outer rings to access the inner ring's resources. Correctly limiting access between rings can improve security by preventing programs from one ring or privilege level from misusing resources intended for programs in another. For example, spyware running as a user program in Ring 3 should be prevented from turning on a web camera without informing the user, since hardware access should be a Ring 1 function reserved for device drivers [1]. Despite the picture above showing four rings, only two are being used: ring 0 and ring 3 are for kernel and user mode.
If we would like to use protections rings successfully, the operating system must closely work with the underlying hardware. But it's often the case that operating systems are designed to work on different hardware, so the operating system can only use a limited number of rings: in most Windows systems, only 2 rings are used.
When the process or a thread is being run by the system, that process/thread has direct access to the privileged functions like accessing real memory, modifying descriptor tables, disabling interrupts, etc... When we would like to use kernel mode under Windows/Linux, we need to perform a system call into kernel mode where the system call is executed and after that, the control is returned to the user space.
The real purpose of the kernel and user mode is to provide protection against system corruption. Let's say we've just written a program that tries to access some non-existent memory address like 0x00000000 or does some other stupid thing. In such cases, since the program is executing in the user mode, only the program will crash; the system will be left unaffected. Now imagine what would happen if we wouldn't have different protections rings: one program like this can endanger the stability of the whole system, in which case the whole system can crash. I'm not saying this can't happen, because we all know the Window's blue screen of death, but this is a rare occurrence that is the result of a bug in the Windows system. This is because the program misbehaves and a fault/exception is generated in user mode, which doesn't affect the stability of the system. But if a fault/exception is generated in the kernel mode, the whole operating system can become unstable and crash the computer.
When debugging, we must also be aware of the fact that all loaded modules the program needs are still in user mode; so kernel32.dll, ntdll.dll and other DLLs are loaded in user-mode. Those DLLs are just gateways into the kernel-mode, but they also provide the error handling and parameter verification. This is because the kernel must receive a valid function call that can't endanger the stability of the system.
The User and Kernel Mode Memory
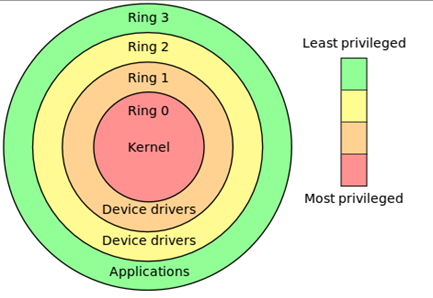
We've just said that when the program is being executed, it's using various modules; system DLLs like kernel32.dll, ntdll.dll, etc... Let's load the calc.exe executable into Ollydbg and checkout all the modules the program uses:
We can see that the calc.exe uses a lot of the DLLs from the C:Windowssystem32 directory, but also some other DLLs. But did you notice that all of the modules are loaded at addresses lower than 0x80000000, even kernel32.dll, ntdll.dll, shell32.dll and user32.dll? This is because the memory in Windows operating system is divided between user and kernel space memory. If the computer has 4GB of memory, 2 GB is used by the kernel and 2 GB are used by the user programs. Each of the user programs has access from 0x00000000 to 0x7FFFFFFF virtual memory addresses. This makes the virtual addresses that range from 0x80000000 to 0xFFFFFFFF kernel memory addresses.
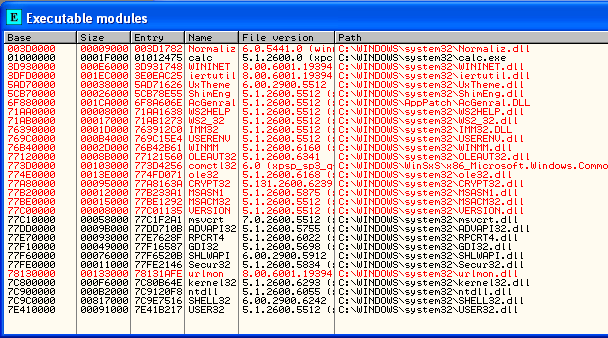
When the program is loaded into memory, it needs to load the required modules and also load itself into the memory space. On the picture above, we can see all the modules loaded into the user memory address space including calc.exe. But every program and DLL also uses segments which occupy their own address space in the occupied address space. Above, we can also see that calc.exe's base address is 0x01000000 to 0x0101F000, so every segment the program uses must be inside this memory space. If we take a look at the memory map in OllyDbg, we can see all the sections of the calc.exe program, which we can see the sections on the picture below:
Notice that all the segments occupy exactly the address space specified by the Executable Modules in OllyDbg?
Calling sysenter from the Defender
In the previous tutorial we've seen the sub_4030E5 function, which was calling into the kernel. That function essentially calls the kernel twice: once from the 0x00174998 address and once from the 0x00174990 address. Let's present what happens when we call the kernel from the 0x00174998 address. When stepping into that function, it's immediately evident that the NtQueryInformationProcess function is being called:
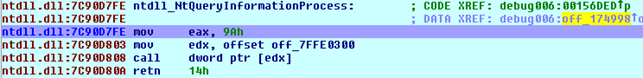
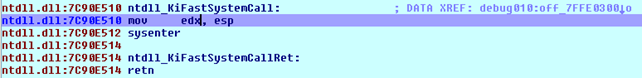
If we step into the function at address 0x7C90D808, it's clear that the KiFastSystemCall function is being called, as seen on the picture below:
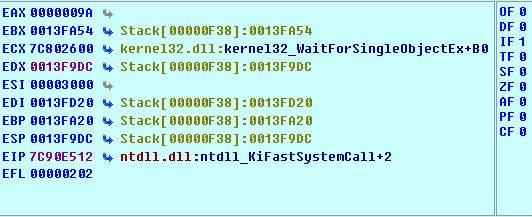
We can see that we're moving the value of esp into the register edx. The registers before executing the sysenter instruction are presented below:
Upon stepping into the sysenter instruction, we're immediately taken to the previously called function NtQueryInformationProcess, as can be seen on the picture below (notice the EIP pointing at the retn instruction after the function call):
Let's also describe what happens when calling the off_174990 function. The instructions from that address can be seen on the picture below:
This essentially calls the function loc_7C90D1B8, which is presented below:
And those instructions then call the KiFastSystemCall that contains the sysenter function call:
We've seen that when stepping into the sysenter instruction, it doesn't actually step into it, but we're immediately thrown to the next instruction on the list as if nothing had happened.
So far we've identified that the Defender.exe program uses the sub_4030E5 function, which calls into the kernel mode. We identified two functions, which eventually call the sysenter instruction. Their function call stack is as follows:
- off_174998 - NtQueryInformationProcess – KiFastSystemCall - sysenter
- off_174990 - loc_7C90D1B8 – KiFastSystemCall - sysenter
Notice that both functions essentially call the KiFastSystemCall that calls the sysenter instruction? This is an important observation. The KiFastSystemCall is in ntdll.dll library, which calls into the kernel mode by using the sysenter instruction. The sysenter instruction is the instruction that transfers control to the kernel and does the system call.
The sysenter Instruction
The sysenter instruction executes a system call to the ring 0 (system mode). Prior to executing the SYSENTER instruction, the software must specify the privilege level 0 code segment and code
entry point, and the privilege level 0 stack segment and stack pointer by writing values to the following MSRs [2]:
The MSR register is a Model-Specific Register and is the control register in the x86 computer used for debugging, program execution tracing, computer performance monitoring, and toggling certain CPU features [3]. We can read and write into those registers by using the rdmsr and wrmsr instructions, which are privileged instructions and therefore must be executed by the operating system. Under Linux, we can install the msrtools package, which will allow us to read the /dev/cpu/x/msr register values (the x is the processor number).
In Windows systems, the sysenter instruction is called in ntdll.dll, which uses the functions KiFastSystemCall and KiIntSystemCall to call the kernel. The KiFastSystemCall uses the sysenter instruction, but needs to be supported by the processor. If it is not, the KiIntSystemCall function can be used that can work without the sysenter support. When calling the sysenter instruction, the value in eax register shows the system call number. Once the sysenter instruction is done executing, it must call the sysexit instruction to get back to the user-mode.
The Example
We won't be cracking the Defender program here, since we're trying to keep it simple. In the previous subsection, we used the Defender.exe program to show that the program used the sysenter instruction to call the kernel-mode functions. In this example, we'll take a look at the C++ code below that also calls the sysenter function. The actual C++ code is presented below:
[cpp]
#include "stdafx.h"
#include <stdio.h>
#include <windows.h>
int _tmain(int argc, _TCHAR* argv[]) {
__asm { int 3 }
typedef long NTSTATUS;
#define STATUS_SUCCESS ((NTSTATUS)0L)
typedef struct _SYSTEM_KERNEL_DEBUGGER_INFORMATION {
BOOLEAN DebuggerEnabled;
BOOLEAN DebuggerNotPresent;
enum SYSTEM_INFORMATION_CLASS { SystemKernelDebuggerInformation = 35 };
typedef NTSTATUS (__stdcall *ZW_QUERY_SYSTEM_INFORMATION)(IN SYSTEM_INFORMATION_CLASS SystemInformationClass, IN OUT PVOID SystemInformation, IN ULONG SystemInformationLength, OUT PULONG ReturnLength);
ZW_QUERY_SYSTEM_INFORMATION ZwQuerySystemInformation;
/* load the ntdll.dll */
HMODULE hModule = LoadLibrary(_T("ntdll.dll"));
ZwQuerySystemInformation = (ZW_QUERY_SYSTEM_INFORMATION)GetProcAddress(hModule, "ZwQuerySystemInformation");
if(ZwQuerySystemInformation == NULL) {
printf("Error: could not find the function ZwQuerySystemInformation in library ntdll.dll.");
exit(-1);
}
if (STATUS_SUCCESS == ZwQuerySystemInformation(SystemKernelDebuggerInformation, &Info, sizeof(Info), NULL)) {
if (Info.DebuggerEnabled && !Info.DebuggerNotPresent) {
printf("System debugger is present.");
}
else {
printf("System debugger is not present.");
}
/* wait */
getchar();
return 0;
}
After that we can compile and execute the program, which will display the following:
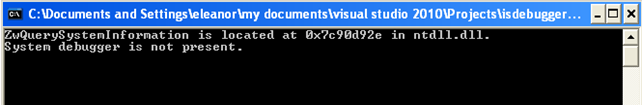
This tells us that the program was able to locate the ZwQuerySystemInformation function in the ntdll.dll library DLL. The program was also able to determine that we're not running a system debugger.
If we load the program in the Ida, we can quickly locate the starting function that starts the execution of the program and that is presented on the picture below:
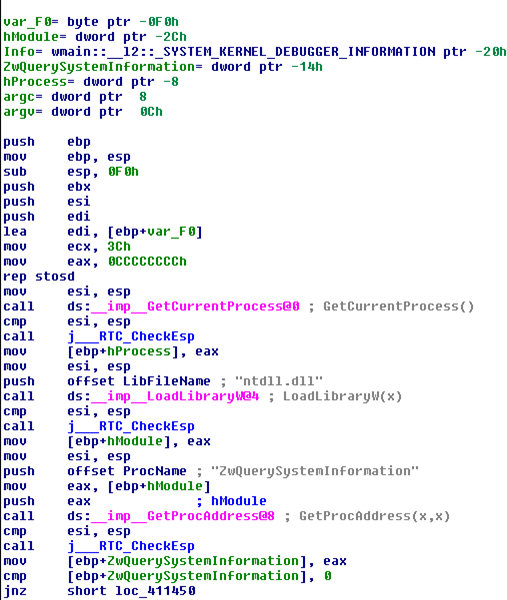
After executing the first block of code above, the program will jump to the address 0x00411450, which contains the code presented on the picture below:
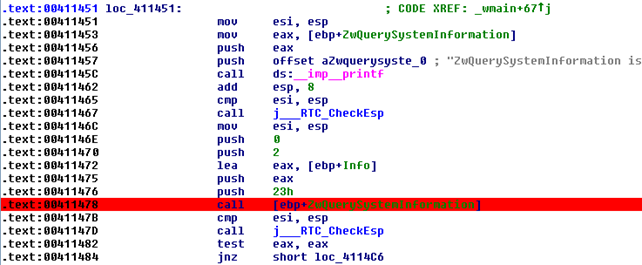
Place a breakpoint on the address 0x00411478, as seen on the picture above. This is the point where the NtQuerySystemInformation function is being called (never mind the Nt being used rather than Zw). Once we enter the breakpoint, the program execution will jump to the following instructions:
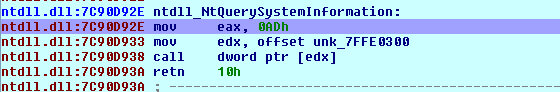
We can see that we're placing the 0xAD into the register eax and saving the address 0x7FFE0300 into register edx. After that, we're calling that address, which essentially calls to the kernel. The instructions at that address can be seen below:
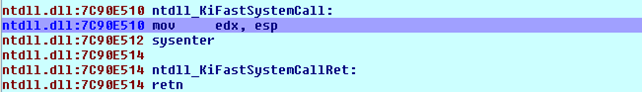
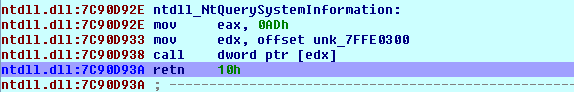
After saving the ESP register by placing its value in the edx register, we're calling the sysenter function. If we try to step into the sysenter instruction with Ida's debugger, we'll be immediately thrown to the address 0x7C9D93A, which is part of the NtQuerySystemInformation function that we previously executed. We can see that on the picture below, where it's also shows that we're thrown to the retn instruction that returns execution to the main program.
When we've stepped-into the sysenter function call, nothing really happened; at least not something that Ida can pick up. This is why we can't debug the kernel code with a user-mode debugger like Ida. To actually follow the system call into the kernel-mode, we need to use a kernel-mode debugger like SoftICE.
Because we can't start a program right from SoftICE, we need to put an additional code into the C++ program which triggers an exception right after starting the program. This is needed so that the program waits as long as we need to attach the SoftICE debugger to it, set the breakpoints and execute the program from beginning. To do that, we need to put the following instruction right after the main function declaration in the C++ code:
[cpp]
__asm { int 3 }
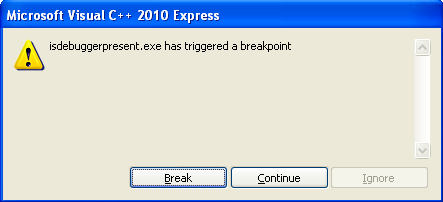
Then we need to compile the code and start it. If we do that right from Visual Studio, we'll get the following pop-up notifying us about a program triggering a breakpoint. We can either stop the program or continue the execution of the program. If we continue, the program it will run normally.
But the real purpose of this is starting the SoftICE debugger and setting it to catch the "int 3" faults, so when starting a program, the breakpoint won't happen because the SoftICE will catch it and handle it. To configure the SoftICE to catch the "int 3" exception we need to execute the "i3here on" instruction, as we can see on the picture below:

If we then open cmd.exe and execute the program from there, the SoftICE debugger will automatically pop-up notifying us about the breakpoint being hit. We can see that on the picture below:
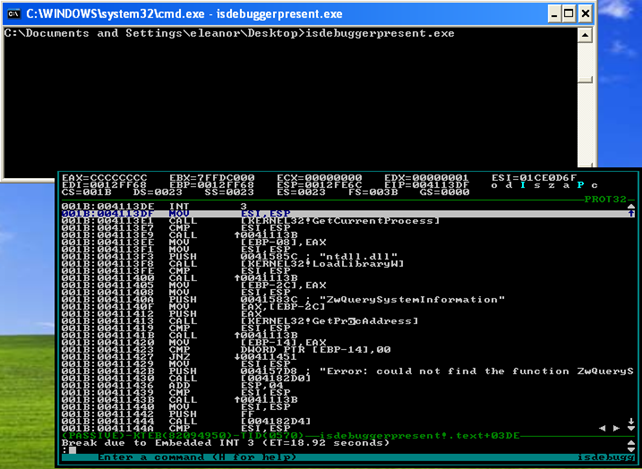
Notice that on the bottom of the SoftICE window, we can see "Break due to the Embedded INT 3"? This is happening because our previously set "int 3" interrupt is being caught by the SoftICE, which is also stopping the execution of the program and presenting us the debugging window.
Then we need to set the breakpoint to the 0x00411477 address where the call to our sysenter instruction is being triggered. We can use the bpx command to set the breakpoint at particular address and the bl command to list all the breakpoints. That can be seen on the picture below:

After that, we need to run the program by executing the x command. Once we've hit the breakpoint, we must enter the function call by executing the t command. After that, we'll be taken to the following instructions:
Those instructions are exactly the same as we've already identified with Ida. If we again step through the instruction with the t command, we'll be taken to the following instructions, which are, once again, the same as we've already identified:

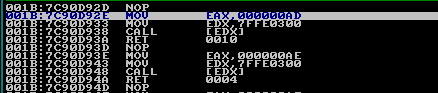
We can see that we've stumbled upon the sysenter instruction, but this time not with Ida, but with SoftICE. Let's use the t command again to step into the sysenter instruction. When we do that with Ida, we were thrown to the 0x7C9D93A address as if nothing had happened. But we know that the kernel-mode code is being executed behind the scenes. If we step into the sysenter instruction with SoftICE, we'll be thrown to the address 0x804DE6F0, as we can see on the picture below:
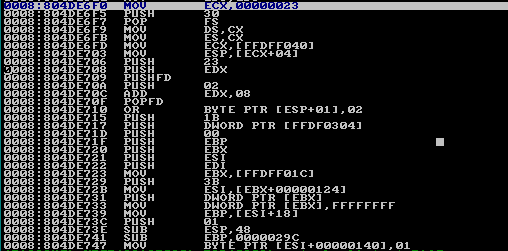
Bingo! This time we're in the kernel-mode and we can successfully debug the code in kernel-mode. This can easily be determined because we jumped to the address that was higher than 0x80000000, which is reserved for the kernel and cannot be used by the processes.
Conclusion
In this tutorial we've presented the protection rings and the user versus kernel memory. We've also seen that we can't really debug the kernel code with Ida's debugger, because Ida can only debug user code. However, we've been successful at debugging the kernel code with SoftICE debugger, but we didn't dig any deeper, because the point of this article is to show that we can indeed break into the kernel code with SoftICE debugger and start analyzing and executing the code in kernel mode.
References:
[1]: Ring (computer security), accessible at http://en.wikipedia.org/wiki/Ring_(computer_security).
[2]: Instruction set reference, accessible at http://www.intel.com/content/www/us/en/architecture-and-technology/64-ia-32-architectures-software-developer-vol-2a-2b-instruction-set-a-z-manual.html

Become a certified reverse engineer!
[3] Model-specific register, accessible at http://en.wikipedia.org/wiki/Model-specific_register.
- Exam Pass Guarantee
- Live expert instruction
- Hands-on labs
- CREA exam voucher
In this Series
- Introduction to Kernel Debugging
- Kali Linux: Top 8 tools for reverse engineering
- Stacks and Heap
- Top 8 reverse engineering tools for cyber security professionals [updated 2021]
- Arrays, Structs and Linked Lists
- Reverse engineering obfuscated assemblies [updated 2019]
- Crack Me Challenge Part 4 [Updated 2019]
- Writing windows kernel mode driver [Updated 2019]
- Assembly programming with Visual Studio.NET
- The basics of IDA pro
- Reverse engineering tools
- Hacking tools: Reverse engineering
- Reverse engineering a JavaScript obfuscated dropper
- Reverse Engineering – LAB 3
- Exploiting Protostar – Stack 0-3
- Reversing Binary: Spotting Bug without Source Code
- Reverse engineering virtual machine protected binaries
- Introduction to Reverse Engineering
- Pafish (Paranoid Fish)
- Extending Debuggers
- Encrypted code reverse engineering: Bypassing obfuscation
- Buffer Overflow Attack & Defense
- Invoking Assembly Code in C#
- iOS Application Security Part 32 - Automating tasks with iOS Reverse Engineering Toolkit (iRET)
- Hooking IDT
- A Guide to Debugging Android Binaries
- Kernel debugging with Qemu and WinDbg
- Shared Folders with Samba and Qemu
- Testing Hooks via the Windows Debugger – An Introduction to RevEngX
- Reverse Engineering with Reflector
- Applied Reverse Engineering with IDA Pro
- Injecting spyware in an EXE (code injection)
- Disassembler Mechanized Part 4: DLL Injector Development
- Disassembler Mechanized Part 3: Code Injection Operation
- Debugging TLS callbacks
- Disassembler Mechanized Part 2: Generating C# and MSIL code
- System address map initialization in x86/x64 architecture part 2: PCI express-based systems
- Coding of Disassembler
- Applied cracking & byte patching with IDA Pro
- .NET reversing with Reflexil
- Reversing firmware part 1
- Reverse Engineering with Reflector: Part 1
- Remoting Technology
- Reverse engineering with OllyDbg
- Understanding Session Fixation
- Optimizing Managed Code Execution
- File system manipulation
- The BodgeIt store part two
- The BodgeIt store part one
- Understanding Windows Internal Call Structure
- Pin: Dynamic Binary Instrumentation Framework

Get certified and advance your career
- Exam Pass Guarantee
- Live instruction
- CompTIA, ISACA, (ISC)², Cisco, Microsoft and more!

Reverse engineering
Reverse engineering
Reverse engineering
Top 8 reverse engineering tools for cyber security professionals [updated 2021]
Reverse engineering