Building Custom Controls in C# - Part 2

ABSTRACT
This article will enable you to understand parallel axis graphs and how you might want to implement a fully functional, albeit basic, yet effective custom control in C#. Graphing and data visualization are hot topics in security and parallel axis graphs are very useful in representing multiple data types or multiple parameters of a system and help patterns emerge from the resulting graph line connections. Such patterns can be very helpful in detecting similarities or anomalies in newer data sets.

11 courses, 8+ hours of training
We will make out own text based data formats, our visual controls from the graph, a data display using a factory control and interactivity with the data set using opacity as the main tool for demarcating particular line segments adjacent to the data set rows. Further functionality can be built once you get the idea.
THE PREMISE
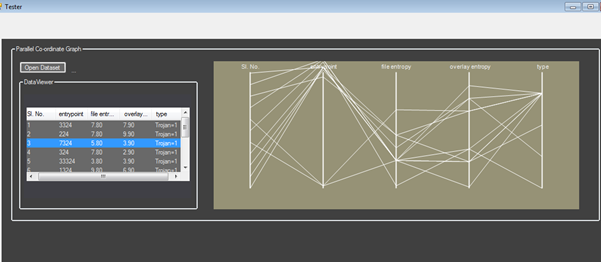
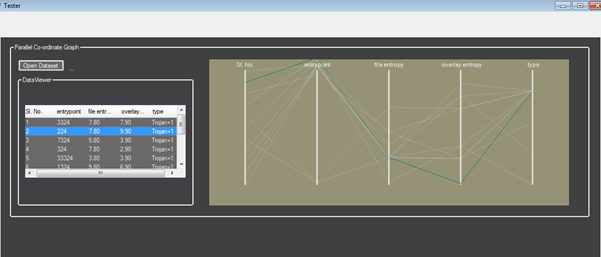
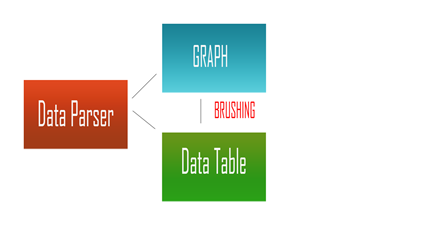
[*]Both of the snapshots above show the parallel axis graph in display mode and brushing mode.
[*]The left side data display box corroborates with the parallel axis display and interacts with it.
[*]The data format is text editable.
[*]The number of columns or lines in the graph is dynamically set (no fixed size limit, but 5-6 is good enough for default size)and can position them uniformly over the entire display.
[*]The column headers are displayed on the top. Values run from the top to bottom andeach range is calibrated to fit in the line length.
[*]Brushing or data interactivity with the display involves reducing the opacity of non-selected lines and coloring the selected line to teal for a better visual effect.
[*]The interface is simple, only needing the user to load a data file for the display and interaction. Further features can be embellished as and when needed. The modular design of the control and classes enable you to do just that.
The dataset format is very simple:
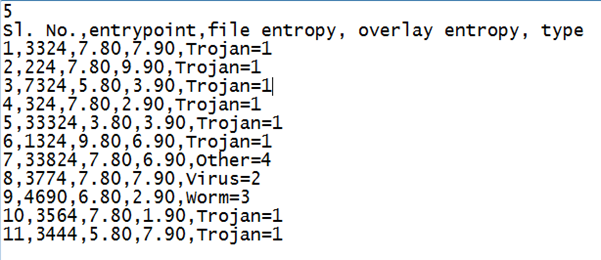
Every line is a singular entity.
The first line always contains the number of lines/columns/fields/parameters required.
The second line contains the names of the fields separated by a space.
Thereafter, every other line until the end of the file is the dataset in the format specified above.
The config file is kept in another file in the same directory
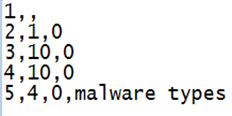
The config file relates to the data types for each of the 5 fields in the preceding data set.
Each line relates to one field.
The first value is the serial number of the type/field.
The second value is the total expected subdivision ranges to be effected by the parsing logic.
The third and the 4th columns are metadata placeholders for further information, if required.
The 1st file name is dataset2.txt and the config file is named dataset2Config.
Both files have to have the same name, with the config file having Config appended in camel case sans extension. You may change the requirements per your needs.
Now that we have finished with our data structure design, let us proceed to the control design.
We need a data parser in the back end and a graphical logic component. Finally, we need a way to interact with data in both text and the corresponding graph. So that's 3 components in all.
We need to use the System. Drawing/System.Drawing.Drawing2D namespaces. Let's start with the data parser code.
DATA PARSER
[csharp][*] Initializing plot variables
string [] datasetMem;
int numberOfPlotLines = 0;
int numberOfColumns = 0;
string[] columnsHolder;
List<string> datasetHolder = newList<string>();
string OpnedPath = String.Empty;
[*] The open fil dialog code for data file input
privatevoid openDatasetButton_Click(object sender, EventArgs e)
{
OpenFileDialog o = newOpenFileDialog();
if (o.ShowDialog() == DialogResult.OK)
{
readyForDisplay = false;
listView1.Clear();
fileReaderBackgroundWorker.RunWorkerAsync(o.FileName);
}
[*] Excerpt of the actual file reading code. All lines are saved in a string array
privatevoid dataSetFileParse(string filePath) {
OpnedPath = filePath;
datasetMem = File.ReadAllLines(filePath);
[*] Splitting of per line as per the format. Split() function is used to extract particular fields from a complete line. In memory storing of the dataset parameters.
privatevoid initGlobalVarFromDataset() {
//the first line contains the number of columns
//the second line contains the columns name strings
columnsHolder=datasetMem[1].Split(',');
numberOfColumns = columnsHolder.Length;
//Initializing the loop variable to start from the 3rd line onwards
//read each line and save them in a string list for later data processing.
int i=2;
for (; i < datasetMem.Length ; i++) {
if (datasetMem[i]!=""){
datasetHolder.Add(datasetMem[i]); //holds the core data records
}
}
MaximumSizeDataInit(OpnedPath); //init
}
//This initializes the listView control and fills it with the data items from the data file.
publicvoid ListViewInit(List<string> data, int nOfCol,string [] columns) {
int i=0;
for (;i<columnsHolder.Length;i++){
listView1.Columns.Add(columnsHolder[i]);
}
int j=0;int index=0;
for (; j < data.Count;j++ ) {
string[] field = data[j].Split(',');
int u = 0; string [] subitems=newstring[field.Length-1];
for (; u < subitems.Length; u++) {
subitems[u]=field[u+1];
}
listView1.Items.Add(data[j].Split(',')[0]);
listView1.Items[index].SubItems.AddRange(subitems);
index++;
}
}
[/csharp]
We need to assign a data structure to store the plot lines parameters and associated data. We initialize a list of type lines, which is a struct to hold all line-related visual data.
The lines struct represents the data required for each line. To construct a vertical line, you would need a top point and a bottom point. Ticks are very useful for grading the data range on the line. Furthermore, a set of properties are initialized within the struct to retrieve the data.
We also initialize a graphLinePoints data structure as a list of the same custom struct type, which contains an array of the points contained in each line after the plotting is done. This is to keep a record of the number of points generated and use that to check for interactivity and data retrieval from the visual area. This done separately for better code maintenance and not included in the previous struct that keeps the entire plot-related data. Thus, in terms of data processing, the second list of points is actually very crucial once the graph construction is done.
[csharp]
List<Lines> plotLinesData = newList<Lines>();
structLines
{
publicPoint TopPoint;
publicPoint BottomPoint;
privatestring Name;
//private int Ticks;
public Lines(Point a, Point b, string c)
{
TopPoint = a; BottomPoint = b; Name = c; //Ticks = d;
}
publicPoint GetTopPoint() { return TopPoint; }
publicPoint GetBottomPoint() { return BottomPoint; }
publicString GetName() { return Name; }
//public int GetLineValueRange() {return Ticks;}
List<graphLinePoints> glp = newList<graphLinePoints>(); //###################//
structgraphLinePoints
{
public graphLinePoints(PointF [] a)
{
points = a;
}
publicPointF[] GetPointArrayFromField()
{
return points;
}
int [] MaximumSizeForEachField;
int[] MinimumSizeForEachField;
privatevoid MaximumSizeDataInit(string filePath) {
if (File.Exists(Path.GetDirectoryName(filePath)+""+Path.GetFileNameWithoutExtension(filePath)+"Config"))
{
string[] pars = File.ReadAllLines(Path.GetDirectoryName(filePath)+""+Path.GetFileNameWithoutExtension(filePath)+"Config");
int r = 0; int p = 0; MaximumSizeForEachField = newint[numberOfColumns];
MinimumSizeForEachField=newint [numberOfColumns];
foreach (string f in pars) {
if (f.Split(',')[1] != "")
{
try
{
MaximumSizeForEachField[r] = Int32.Parse(f.Split(',')[1]);
r++;
}
catch (Exception n) { }
}
if (f.Split(',')[2] != "")
{
try
{
MinimumSizeForEachField[p] = Int32.Parse(f.Split(',')[2]);
p++;
}
}
else {
}
}
}
[/csharp]
The code to generate the data for the lines and their ticks in the first pass is quite simple. You iterate for the number of columns required and set the top and bottom points as per the area and aesthetics. I set the top point to always start with a height of 20 pixels from the graph area; this would be the Y coordinate for every such point (x,y). The x axis related starting offset is calculated from the total width of the graph area/the number of plot lines required. This would give the division distance in pixels for every next line to start from.
Thus, we just add the offset to every next point generated to balance out the total graph area into equidistant lines. The same is done for the bottom lines. Next, we process each line in the extracted data set list and generate the points list for each line.
[csharp]
privatevoid plotLineGenerator() {
int t = this.panelPCG.Height - 40 - 20; ; // Y range holder
List<Point> fieldXPoint = newList<Point>();
List<Point[]> lineRangeHolder = newList<Point[]>();
int i = 0; int divisions = this.panelPCG.Width / numberOfPlotLines; int starter = 0;
for (; i < numberOfPlotLines; i++)
{
plotLinesData.Add(newLines(newPoint(divisions / 2 + starter, 20),
newPoint(divisions / 2 + starter, this.panelPCG.Height - 40), columnsHolder[i]));
fieldXPoint.Add(newPoint(divisions / 2 + starter, t));
//the Y co-ordinate in 'fieldXPoint' stores the distance between the top and bottom line points
starter += divisions;
foreach (string d in datasetHolder) { //point generator
string[] record = d.Split(',');
int k=0;
PointF [] pointer=newPointF[record.Length]; //temp holder
for (;k<record.Length;k++){
if (record[k].Contains("=")) {
string numeric=record[k].Substring((record[k].IndexOf("=")+1),1);
pointer[k] = newPointF((float)fieldXPoint[k].X, (((float.Parse(numeric)-MinimumSizeForEachField[k]) / (float)MaximumSizeForEachField[k])) * (t + 20));
}
elseif (k==1) {
//string hexor = record[k].Substring((record[k].IndexOf("x") + 1), record[k].Length);
pointer[k] = newPointF((float)fieldXPoint[k].X, ((Norm2GB(record[k]))) * (t + 20));
}
else
{
pointer[k] = newPointF((float)fieldXPoint[k].X, (((float.Parse(record[k]) - MinimumSizeForEachField[k]) / (float)MaximumSizeForEachField[k])) * (t + 20));
}
glp.Add(newgraphLinePoints(pointer));
}
readyForDisplay = true; panelPCG.Invalidate();
}
privatefloat Norm2GB(string EP)
{
int y = Convert.ToInt32(EP, 16);
float rangeMaxDefPageStartAddr = 209409; //in divisions of 10 pages
float rank;
if (y <= 209409)
{
rank = (float)(y - 4096) / rangeMaxDefPageStartAddr;
}
else { rank = (float)(y - 4096) / (rangeMaxDefPageStartAddr + (y - rangeMaxDefPageStartAddr)); }
return rank;
}
Finally, the actual drawing code is done in the paint loop. Here, a flag 'readyForDisplay' is set so that the graph would not draw itself before the datasets are ready and the lines/points are calculated.
We set the smoothing mode to Antialias as the lines have to crisp. This feature comes from the System.Drawing.Drawing2D class. Thereafter, we iterate each data structure for both, the plot lines 'Lines' and the points container 'graphLinePoints'. The syntax for the DrawLine() method is simple as well.
It takes a pen instance, start point and end point as arguments. The pen class abstracts a virtual pen and thus, lines are best drawn with a thin nib. DrawString() is used to name the header of each line. It takes the input string, font, color and the position.
To draw the ticks for each data in each line, another function called DrawLines() is used. This takes a pen instance and a points array. This would draw lines connecting each point from every other line for a particular dataset row. Like a 'join the dots' kind-of thing. This simplifies setting and working with an extensive number of points. Hence, you can now see the additional benefit of separating the graph code and the points data structure. Debugging would also be easy this way.
[csharp]
privatevoid plotPointsGenerator() {
}
privatebool fieldClicked=false;
privatevoid panelPCG_Paint(object sender, PaintEventArgs e)
{
if (readyForDisplay)
{
foreach (Lines l in plotLinesData)
{
e.Graphics.DrawLine(newPen(newSolidBrush(Color.White), 2), l.GetTopPoint(), l.GetBottomPoint());
SizeF s = e.Graphics.MeasureString(l.GetName(), newFont("Arial", 8));
e.Graphics.DrawString(l.GetName(), newFont("Arial", 8), newSolidBrush(SystemColors.Control), newPointF(((float)l.GetTopPoint().X) - s.Width / 2, 3));
//foreach (graphLinePoints j in glp){
if (fieldClicked)
{
for (int k = 0; k < glp.Count; k++)
{
if (k != listView1.SelectedIndices[0])
{
e.Graphics.DrawLines(newPen(newSolidBrush(Color.FromArgb(50, 255, 255, 255)), 0.5f), glp[k].GetPointArrayFromField());
}
else
{
e.Graphics.DrawLines(newPen(newSolidBrush(Color.Teal), 1), glp[k].GetPointArrayFromField());
}
}
}
else
{
foreach (graphLinePoints g in glp)
{
e.Graphics.DrawLines(newPen(newSolidBrush(Color.White), 1), g.GetPointArrayFromField());
}
//} //end of foreach
}
}
At this point, the listView that displays the textual data in a table is set to refresh the graph with a fieldClicked boolean parameter and the invalidate() method of the graph area is invoked.
[csharp]
privatevoid listView1_Click(object sender, EventArgs e)
{
if (listView1.SelectedItems.Count > 0)
{
fieldClicked = true;
panelPCG.Invalidate();
}
}
The logic for changing the graph lines color and opacity is very simple as well. This is the same excerpt of the code above. Here, we check if fieldClicked = true; if true, then we run the segment below first, else the 'default' case. The listView itself keeps a record of the selected index. I disabled multi selections for this example. Thus, we simply check for the selected index in the listView and accordingly set the opacity and the color of that field connecting lines.
The SolidBrush class takes the color value. The color value is set to Color.FromArgb(50,255,255,255) – meaning an opacity of 50 (runs from 1 to 255) and a color of white (255,255,255). The selected line is set to full opacity and a color teal shade. This makes it stick out from the rest.
[csharp]
for (int k = 0; k < glp.Count; k++)
{
if (k != listView1.SelectedIndices[0])
{
e.Graphics.DrawLines(newPen(newSolidBrush(Color.FromArgb(50, 255, 255, 255)), 0.5f), glp[k].GetPointArrayFromField());
}
else
{
e.Graphics.DrawLines(newPen(newSolidBrush(Color.Teal), 1), glp[k].GetPointArrayFromField());
}
The same feature can be enabled in the graph area as well, wherein if the user hovers around the line at the particular data set regions, the value would pop up in the location making it more interactive. The user could also move the lines around and accordingly, the graph should update itself.
Large data ranges have to be accommodated for as well. And finally, support for graph zoom. Can you think of other interesting features you can code for your custom graph control that processes and displays your own data set? In terms of data sets – you could code for standard issue XML or SQL queries as well. Customise it as you want.
CONCLUSION

You have taken a good look at the approach and the process from start to finish of how to make your own custom controls and the kind of design and coding effort that goes into it. Simplicity is the key in C#. The GDI+ library in .NET has made graphics coding very intuitive and efficient for data processing and visualization needs.

In this Series
- Building Custom Controls in C# - Part 2
- DevSecOps: Moving from “shift left” to “born left”
- What’s new in the OWASP Top 10 for 2023?
- DevSecOps: Continuous Integration Continuous Delivery (CI-CD) tools
- Introduction to DevSecOps and its evolution and statistics
- MongoDB (part 3): How to secure data
- MongoDB (part 2): How to manage data using CRUD operations
- MongoDB (part 1): How to design a schemaless, NoSQL database
- Understanding the DevSecOps Pipeline
- API Security: How to take a layered approach to protect your data
- How to find the perfect security partner for your company
- Security gives your company a competitive advantage
- 3 major flaws of the black-box approach to security testing
- Can bug bounty programs replace dedicated security testing?
- The 7 steps of ethical hacking
- Laravel authorization best practices and tips
- Learn how to do application security right in your organization
- How to use authorization in Laravel: Gates, policies, roles and permissions
- Is your company testing security often enough?
- Authentication vs. authorization: Which one should you use, and when?
- Why your company should prioritize security vulnerabilities by severity
- There’s no such thing as “done” with application security
- Understanding hackers: The insider threat
- Understanding hackers: The 5 primary types of external attackers
- Want to improve the security of your application? Think like a hacker
- 5 problems with securing applications
- Why you should build security into your system, rather than bolt it on
- Why a skills shortage is one of the biggest security challenges for companies
- How should your company think about investing in security?
- How to carry out a watering hole attack: Examples and video walkthrough
- How cross-site scripting attacks work: Examples and video walkthrough
- How SQL injection attacks work: Examples and video walkthrough
- Securing the Kubernetes cluster
- How to run a software composition analysis tool
- How to run a SAST (static application security test): tips & tools
- How to run an interactive application security test (IAST): Tips & tools
- How to run a dynamic application security test (DAST): Tips & tools
- Introduction to Kubernetes security
- Key findings from ESG’s Modern Application Development Security report
- Microsoft’s Project OneFuzz Framework with Azure: Overview and concerns
- Software maturity models for AppSec initiatives
- Best free and open source SQL injection tools [updated 2021]
- Pysa 101: Overview of Facebook’s open-source Python code analysis tool
- Improving web application security with purple teams
- Open-source application security flaws: What you should know and how to spot them
- Android app security: Over 12,000 popular Android apps contain undocumented backdoors
- 13 common web app vulnerabilities not included in the OWASP Top 10
- Fuzzing, security testing and tips for a career in AppSec
- 14 best open-source web application vulnerability scanners [updated for 2020]
- 6 ways to address the OWASP top 10 vulnerabilities
- Ways to protect your mobile applications against hacking

Get certified and advance your career
- Exam Pass Guarantee
- Live instruction
- CompTIA, ISACA, (ISC)², Cisco, Microsoft and more!

Application security
Application security
Application security
DevSecOps: Continuous Integration Continuous Delivery (CI-CD) tools
Application security