Debugging Apps on Android Emulator Using GDB

This article shows how to debug a process running on a rooted Android device or emulator. Debugging a process is an essential task in order to find memory corruption like vulnerabilities in an application.
Prerequisites to follow the steps:

What should you learn next?
- Set up an Android Emulator
- NDK - This can be downloaded from the link below
http://developer.android.com/tools/sdk/ndk/index.html
What are we going to do here?
In simple steps, this is what we are going to do:
- Set up GDB Server on the emulator
- Connect to the GDB server from the client
- Start debugging
Let's begin.
The first step is to push the gdb server to the emulator. We want to access it from any location on the device, so one way is to put it inside /system/bin directory.
Let's first get the shell on the device using "adb" and run "mount" command as shown below.
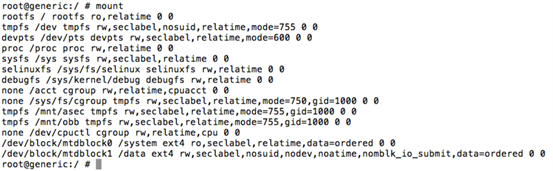
As we can see from the above figure, /system is mounted with "ro" permissions. Since we need to write some files into this, let's remount it using "rw" as shown below.

Let's now check with "mount" command.
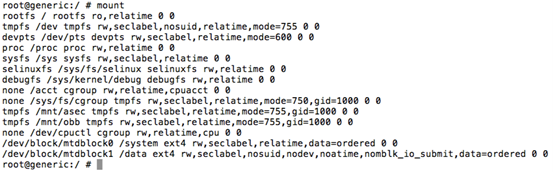
If you notice, /system partition is now mounted with "rw".
It's time to push our gdbserver on to the emulator.
Navigate to NDK directory and identify the ARM binary location. In my case, it is inside "prebuilt/android-arm" directory as shown below.

Push gdbserver on the emulator using "adb push" command.

To cross-check if it is uploaded or not, get a shell on the device using "adb" and type the following command.
"gdbserver –help"
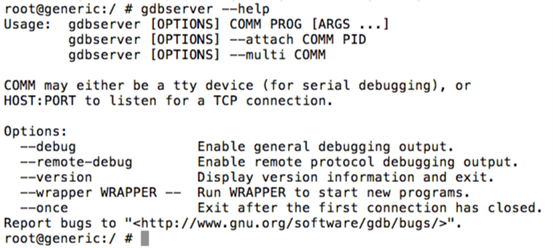
As we can see in the above figure, gdb server is running fine.
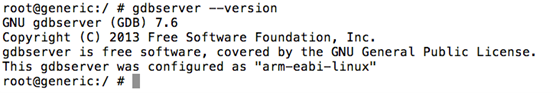
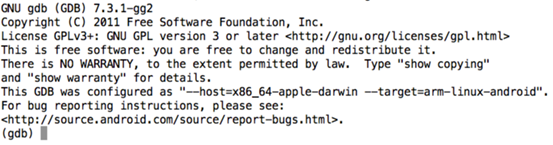
We can check gdbserver version as shown in the following figure.
In order to hook into a process using gdb, we need the process id. Let's find a sample process ID using "ps" command. In my case, I am finding the process id of an app running on the device. This is shown in the figure below.

As we can see, 1234 is the process id of the target process.
Following figure shows how to attach to this process using gdbserver.
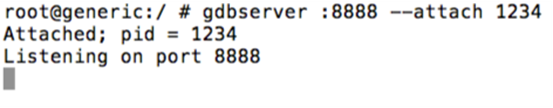
Note: We can also directly hooking into a program using the following command.
gdbserver :8888 [filename] [arguments]
Now, that gdbserver is running. Once this done, we need to forward port 8888 using "adb forward" as shown below.

Once we are done with all the above steps, we are ready to start our precompiled gdb client.
We can launch the precompiled gdb client as shown below.

As we can see in the above figure, we will get a gdb console. Now, we need to connect to the gdbserver instance running on the emulator. We can do it as shown below.
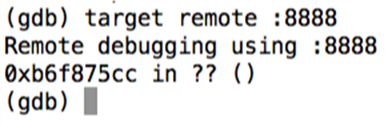
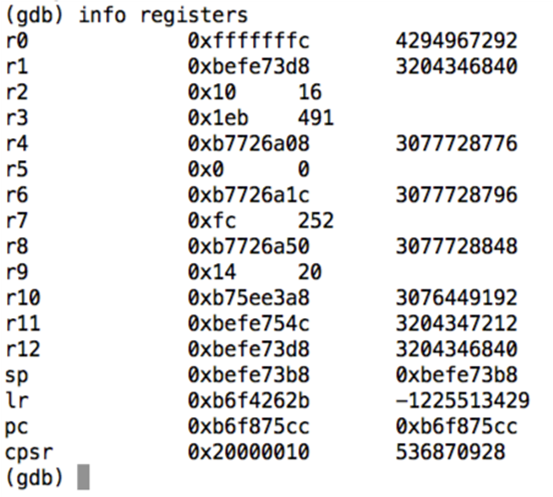
Great! We can now interact with the target process. Let's list the registers.

FREE role-guided training plans
What you can do with this setup is up to your imagination. In a later article, I will show how we can find memory corruption vulnerabilities in NDK apps using GDB with the same setup.

- 12 pre-built training plans
- Employer-requested skills
- Personalized, hands-on training
In this Series
- Debugging Apps on Android Emulator Using GDB
- Free Valentine's Day cybersecurity cards: Keep your love secure!
- How to design effective cybersecurity policies
- What is attack surface management and how it makes the enterprise more secure
- Is a cybersecurity boot camp worth it?
- The aftermath: An analysis of recent security breaches
- Understanding cybersecurity breaches: Types, common causes and potential risks
- Breaking the Silo: Integrating Email Security with XDR
- What is Security Service Edge (SSE)?
- Cybersecurity in Biden’s era
- Password security: Using Active Directory password policy
- Inside a DDoS attack against a bank: What happened and how it was stopped
- Inside Capital One’s game-changing breach: What happened and key lessons
- A DevSecOps process for ransomware prevention
- What is Digital Risk Protection (DRP)?
- How to choose and harden your VPN: Best practices from NSA & CISA
- Will immersive technology evolve or solve cybercrime?
- Twitch and YouTube abuse: How to stop online harassment
- Can your personality indicate how you’ll react to a cyberthreat?
- The 5 biggest cryptocurrency heists of all time
- Pay GDPR? No thanks, we’d rather pay cybercriminals
- Customer data protection: A comprehensive cybersecurity guide for companies
- Online certification opportunities: 4 vendors who offer online certification exams [updated 2021]
- FLoC delayed: what does this mean for security and privacy?
- Stolen company credentials used within hours, study says
- Don’t use CAPTCHA? Here are 9 CAPTCHA alternatives
- 10 ways to build a cybersecurity team that sticks
- Verizon DBIR 2021 summary: 7 things you should know
- 2021 cybersecurity executive order: Everything you need to know
- Kali Linux: Top 5 tools for stress testing
- Android security: 7 tips and tricks to secure you and your workforce [updated 2021]
- Mobile emulator farms: What are they and how they work
- 3 tracking technologies and their impact on privacy
- In-game currency & money laundering schemes: Fortnite, World of Warcraft & more
- Quantitative risk analysis [updated 2021]
- Understanding DNS sinkholes - A weapon against malware [updated 2021]
- Python for network penetration testing: An overview
- Python for exploit development: Common vulnerabilities and exploits
- Python for exploit development: All about buffer overflows
- Python language basics: understanding exception handling
- Python for pentesting: Programming, exploits and attacks
- Increasing security by hardening the CI/CD build infrastructure
- Pros and cons of public vs internal container image repositories
- CI/CD container security considerations
- Vulnerability scanning inside and outside the container
- How Docker primitives secure container environments
- Top 4 Zapier security risks
- Common container misconfigurations and how to prevent them
- Building container images using Dockerfile best practices
- Securing containers using Docker isolation
- Introduction to container security

Get certified and advance your career
- Exam Pass Guarantee
- Live instruction
- CompTIA, ISACA, (ISC)², Cisco, Microsoft and more!

General security
Free Valentine's Day cybersecurity cards: Keep your love secure!

General security
General security